Team Status Report for 4/27

This week we mainly worked on the final presentation and slides and made sure that we had all the information presented well. We also worked on making final adjustments to the overall integration of all three components and we will continue to work on this for the rest of this week as well before the final demo on Friday. The most significant risk at this time is making sure that we are able to successfully demo our final product and we can ensure that everything goes well by doing several practice runs this week. We are all very confident that our demo will go well and are looking forward to completing our final product. We are all on schedule as well and were able to stay on track with the Gantt chart that we made earlier this semester. For next week, we will make sure to submit the final poster, video, and report.

Below are the unit tests and overall system tests carried out for experimentation of our system for the Camera-Based Detection. For the EEG, the test results/ procedure were outlined in Rohan’s individual report last week. 

  • Yawning, microsleep, gaze, phone, other people, user away
    • Methodology
      • Test among 5 different users
      • Engage in each behavior 10 times over 5 minutes, leaving opportunities for the models to make true positive, false positive, and false negative predictions
      • Record number of true positives, false positives, and false negatives
      • Behaviors
        • Yawning: user yawns
        • Sleep: user closes eyes for at least 5 seconds
        • Gaze: user looks to left of screen for at least 3 seconds
        • Phone: user picks up and uses phone for 10 seconds
        • Other people: another person enters frame for 10 seconds
        • User is away: user leaves for 30 seconds, replaced by another user
    • Results

  • Overall system usability and usefulness
    • Methodology
      • Test among 10 different users
      • Have them complete 10 minute work session using the app
      • Ask after if they think the app is easy to use and is useful for improving their focus
    • Results
      • 9 of 10 users agreed
  • Data capture and analysis latency
    • Methodology
      • Video processing
        • Measure time between processing of each frame
        • Get average over a 5 minute recording
    • Results
      • Video processing
        • 100 ms
      • Focus/flow detection
        • 0.004ms

Karen’s Status Report for 4/27

This week I am continuing to work on integration and improvements to the UI. I am working on improving the user flow focusing on the calibration page and display. Previously, clicking the get started button would trigger a Python script to start running which would take a long time as modules are imported and it would also cause a new terminal window to open. This was a hindrance to the user experience, so I made some changes so that a Python script is running at all times in the background. I changed some logic with the session ID creation in the backend to allow for this new user flow.

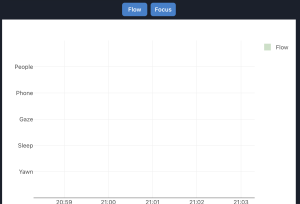
I am also working with Rohan to integrate focus and flow together in the web app. I am working on adding toggle buttons that allow you to toggle between displaying the focus vs flow predictions. I will also be working with him on setting up a calibration phase for the EEG headset to calibrate the readings in the web app.

Overall I’ve been making great progress, am on schedule, and am just adding some final touches to the UI.

Focus and flow toggle buttons:

Arnav’s Status Report for 4/27

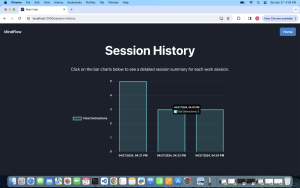
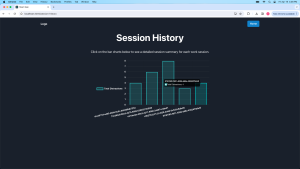
This week I spent time preparing for the final presentation, improving the Session History Page, and additional testing for the whole system. For the final presentation, I made sure that we had the Session History Page integrated with the camera so that we could include this in the current solution slide for the presentation. I also made sure to do some additional research and read extra documentation so that I knew all the details regarding the project and could present all of the work we have done this semester. For the Session History Page, I made it so the date of the session is now on the x-axis (rather than the session id) and the user can easily see how they are improving over time. Below is a screenshot of how the page looks:

I am on schedule and am looking forward to the final demo this Friday. I am now working with Rohan and Karen to make sure all the components of the project are fully integrated for the demo and that all parts of the UI are working as expected. I am also working on our respective parts of the final poster, final video, and final report. This project has been a great learning experience and I am excited to show everyone our final product!

Karen’s Status Report for 4/20

Now that I have finished implementation of all the distraction and behavior detections, I spent time testing and verifying the integrated system. I tweaked thresholds so that the detections would work across different users. 

My testing plan is outlined below, and the results of testing can be found here.

  • Test among 5 different users
  • Engage in each behavior 10 times over 5 minutes, leaving opportunities for the models to make true positive, false positive, and false negative predictions
  • Record number of true positives, false positives, and false negatives
  • Behaviors
    • Yawning: user yawns
    • Sleep: user closes eyes for at least 5 seconds
    • Gaze: user looks to left of screen for at least 3 seconds
    • Phone: user picks up and uses phone for 10 seconds
    • Other people: another person enters frame for 10 seconds
    • User is away: user leaves for 30 seconds, replaced by another user

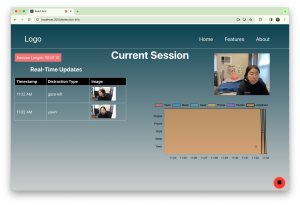
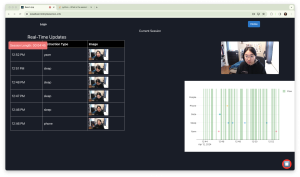
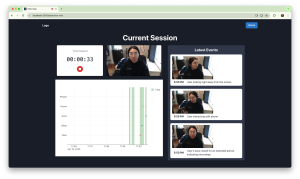
After completing testing, I focused my effort on integration, getting flow state and distractions displayed on the current session page. I also made significant improvements to the UI to reach our usability and usefulness requirements.This required a lot of experimentation with different UI libraries and visualization options. I’ve attached some screenshots of the iterative process of designing the current session page.

My next focus is improving the session summary page and fully integrating the EEG headset with our web app. Currently, the EEG data visualizations are using mock data that I am generating. I would also like to improve the facial recognition component as the “user is away” event results in many false positives at the moment. With these next steps in mind and the progress I have made so far, I am on track and schedule.

One of the new skills I gained by working on this project is how to organize a large codebase. In the past, I’ve worked on smaller projects individually, giving me leeway to be more sloppy with version control, documentation, and code organization without major consequences. But with working in a team of three on a significantly larger project with many moving parts, I was able to improve my code management, collaboration, and version control skills with git. This is also my first experience fully developing a web app, implementing everything from the backend to the frontend. From this experience, I’ve gained a lot of knowledge about full-stack development, React, and Django. In terms of learning strategies and resources, Google, Reddit, Stack Overflow, YouTube, and Medium are where I was able to find a lot of information on how others are using and debugging Python libraries and React for frontend development. It was helpful for me to read Medium article tutorials and watch YouTube tutorials of a “beginner” project using a new library or tool I wanted to use. From there, I was able to get familiar with the basics and use that knowledge to work on our capstone project with a bigger scope.


Arnav’s Status Report for 4/20

This week and last week, I spent a lot of time improving the overall UI of the application, adding a Session History page that allows the user to see statistics from previous work sessions, and testing the backend integration to ensure that all components are working well. 

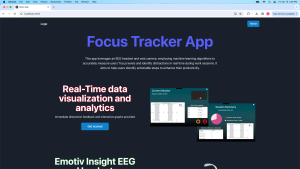
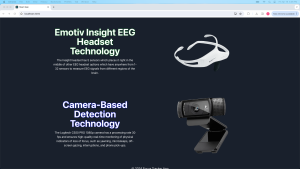
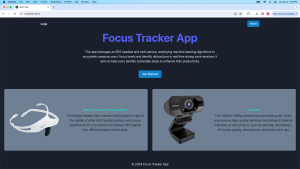
I continued to build upon the UI enhancements I made last week and made it even more visually appealing. I did more research on the Chakra UI and also worked with Photoshop to add images of the headset and camera on the homepage. Below are pictures of how the current homepage looks:

The Session History page is where users can see data from all the previous sessions in one viewing allowing them to see how they are improving in limiting the number of distractions. Currently, we keep track of the session_id and frequency for each distraction when sending the data to the Django backend. I created a new endpoint (http://127.0.0.1:8000/api/session_history) and added the total number of distractions to the data payload along with the session_id and timestamp so that the frontend can fetch this information from the endpoint and display it on the react page. I made sure to update the backend so that it checks to see if the session_id already exists in the database before updating the number of distractions. This ensures that the data from the specific session_id is only shown once on the endpoint and not every time a new distraction occurs.  Users can now see a graph for Total Distractions over all sessions and when the user clicks on the bar chart, it takes the user to the specific Session Summary page corresponding to that session. Below is an example of how the Session Summary page looks:

Throughout the development of this project, I found it essential to learn several new skills and tools, particularly in frontend development using React component libraries, backend development with Django, and integrating both with hardware (camera and Emotiv EEG headset). To efficiently acquire these skills, I relied on tutorial videos on YouTube to understand React and used Stack Overflow and various Medium articles to troubleshoot specific issues I encountered with Django and database integration. Additionally, for the hardware integration, I referred to specific documentation and community forums from the EEG headset and Camera API for real-world insights and coding examples. These methods were efficient, offering targeted, real-time solutions that I could immediately apply to address any concerns during the project.

I am on schedule and am looking forward to the last couple of weeks. I am now working on integrating the Session History page with the EEG data so that our app can display a graph for the % of time in a flow/ focus state for all the given sessions. I will also continue to work on further improving the UI and preparing for the final presentation on Monday.

Team Status Report for 4/6

The most significant risk right now is the accuracy of our flow state detector. After determining a good level of accuracy on our testing data from Professor Dueck in a musician setting, we went on to perform validation in the other settings this week. Rohan performed and recorded EEG data for an activity to stimulate flow state (playing a video game) with noise-canceling headphones and music to encourage flow state for 15 minutes. He then recorded a baseline of performing a regular work task with distractions (intermittent conversation with a friend) for another 15 minutes. On the intended flow recording, our model predicted .254% of the time was in flow and in the intended not-in-flow recording, our model predicted .544% of the time was in flow. We have a few ideas as to why the model may be performing poorly in this validation context. First of all we think that in both settings, Rohan did not enter a flow state because neither task was second nature or particularly enjoyable and also 15 minutes is likely too short of a period to enter a flow state. To further validate the flow detection model, we plan to have Rohan’s roommate who is an avid video gamer wear the headset while playing games for an extended period of time to see how the model performs in detecting flow in a gaming environment. Depending on how this goes, we plan to validate the model again in the music setting to see if our model has overtrained to detect flow specifically in a musical setting.

Rohan also implemented a custom focus state detector. We collected recordings of Arnav, Karen, and Rohan in 15 minute focused and then 15 minute distracted settings while collecting EEG data from the headset. The model achieved high test accuracy on data it had not seen before and had strong precision, recall, and F1 scores. We collected data with Karen wearing the headset again, this time for 20 minutes in focus and 20 minutes distracted to use for model validation. When we ran this data through the custom focus detector, we saw a disproportionately high amount of distracted classifications and overall poor performance. We realized that the original training set only had 28 high quality focus data points for Karen compared to 932 high quality distracted data points for Karen. So, we attribute the poor performance to the skewed training data, plan to incorporate this validation data as training data for the model, and collect new validation data to ensure that the model is performing well. As a backup, we inspected the Emotiv Performance Metrics for focus detection and saw a clear distinction in the average focus Performance Metric in the focused recording as compared to the distracted recording. 

Finally, as an attempt to further validate our custom models, Rohan applied Shapley values which are a measure used in explainable AI to understand which input features are contributing most significantly to the flow vs not in flow classification. 

Validation for video processing distraction detection:

  • Yawning, microsleep, gaze
    • Test among 3 different users
    • Have user engage in behavior 10 times
    • Record number of true positives, false positives, and false negatives
  • Phone pick-up
    • Test among 5 different phones (different colors, Android/iPhone)
    • Have user pick-up and use phone 10 times (5-10 second pick-up and use)
    • Record number of true positives, false positives, and false negatives
  • Other people
    • Test among 1 user and 3 other people
    • Have other person enter frame 10 times (5-10 second interaction)
    • Record number of true positives, false positives, and false negatives
  • Face recognition
    • Test among 3 different users
    • Register user’s face in calibration
    • Imposter takes place of user 3 times in a given work session
      • Imposter takes user’s place in 30 second intervals
    • Record number of true positives, false positives, and false negatives for imposter being recognized
  • Performance
    • Calculate average FPS over every 10 frames captured, logic below
    • Get average FPS over a 1 minute recording

        if COUNTER % FPS_AVG_FRAME_COUNT == 0:

            FPS = FPS_AVG_FRAME_COUNT / (time.time() START_TIME)

            START_TIME = time.time()

        COUNTER += 1

Overall, integration is going smoothly as we have all of the distraction types integrated into the frontend and backend of the web app except for face recognition. Besides the hiccup in the accuracy of our flow state detector, our team is overall on schedule.

Besides improving the focus and flow state detector performance, Arnav and I will be focusing this coming week on improving the UI to improve the user experience.

Arnav’s Status Report for 4/6

This week, I put a lot of effort into combining the backend and frontend parts of our project, focusing especially on adding EEG data to the frontend for the interim demo. I also looked for new ways to make our app look better and be more user-friendly by trying out different React UI component libraries. 

I worked with Rohan on integrating real-time EEG data visualization into our frontend. We created an interactive pie chart that differentiates between moments of focus and distraction, offering users a visually engaging way to understand their focus levels.

For the new UI, I looked at various React UI component libraries including Chakra UI, Material UI, and React Bootstrap. Among them, Chakra UI stood out because it is easy to use and made our app look much better. I revamped the homepage with images and descriptions of the emotive headset and camera. These enhancements help describe the technology behind the focus-tracking app, providing users with clear insights into how the system works to monitor their focus levels. Below is the new-looking homepage:

Regarding the testing/verification for my subsystem, I focused on ensuring seamless communication between our Django backend and React frontend. First, I worked on API Response Testing by sending numerous requests to our backend every minute, aiming to simulate how a user would interact with the app. This was crucial for verifying that data from the EEG headset and camera was being processed quickly and accurately. My target was for our backend to handle these requests in under a second, ensuring users experienced no noticeable delays. Next, I tested the UI Responsiveness. I wanted to make sure that as soon as our backend processed new data, our frontend would immediately reflect these updates (in under 500 milliseconds) without any need for users to manually refresh their browsers. Both tests were successfully completed and I will work on continuing to test other parts of the integration over the next week. 

Overall, I am on schedule and next week I will continue to work on enhancing the frontend for the rest of the pages and make sure that it engages the audience for the final demo. The backend integration is already complete and I will continue to test it further to ensure it is fully accurate and meets the requirements stated in our design report.

Karen’s Status Report for 4/6

This week, I completed integration of phone pick-up and other people distraction detection into the backend and frontend of our web application. Now we can see the phone and other people distraction type displayed in the current session page.

I also have finished the facial recognition implementation. I decided on the Fast MT-CNN model for facial detection and the SFace model for facial embeddings. This produced the best results in terms of a balance between accuracy and speed. This is the core of the facial recognition module with the rest of the logic in the run.py and utils.py scripts. The program now recognizes when the user is no longer recognized or not in frame and reports how long the user was missing for. 

User not recognized:  08:54:02
User recognized:  08:54:20
User was away for 23.920616388320923 seconds

I also recognized that adding facial recognition significantly slowed down the programming since facial recognition requires a large amount of processing time. Because of this, I implemented asynchronous distraction detection using threading so that consecutive frames can be processed simultaneously. I am using the concurrent.futures package to achieve this.

executor = ThreadPoolExecutor(max_workers=8)

A next step would be recognizing when the user is simply not in frame vs. when there is an imposter taking place of the user. After that would be integrating the facial recognition data into the frontend and backend of the web app. In the following week, I will focus on facial recognition integration and properly testing to verify my individual components.

I have some initial testing of my distraction detection components. Arnav, Rohan, and I have all used yawning, sleeping, and gaze detection with success. From initial testing, these modules work well across different users and faces. Initial testing of other people detection has shown success and robustness for a variety of users. Phone pick-up detection needs more testing with different users and different colored phones, but initial testing shows success on my phone. I also need to begin verification that face recognition works for different users, but it has worked well for myself for now.

I have already performed some verification of individual components, such as the accuracy of the YOLOv8 phone object detector and the accuracy of MT-CNN and SFace. More thorough validation methods for the components integrated in the project as a whole are listed in our team progress report.

In the coming week I will work on the validation and verification methods. Now that all of the video processing distraction detections are implemented, I will work with Arnav on making the web application cleaner and more user friendly.

Karen’s Status Report for 3/30

This week I focused on integration and facial recognition. For integration, I worked with Arnav to understand the frontend and backend code. I now have a strong understanding of how the distraction data is sent to our custom API so that they can be displayed in the webpage. Now, sleep, yawning, gaze, phone, and other people detection are integrated into the frontend and backend.

I also worked on splitting calibration and distraction detection into separate scripts. This way, calibration data is saved to a file so that it can be retrieved when the user actually begins the work session and so it can be used in future sessions. I updated the backend so that the calibration script is triggered when the user navigates to the calibration page when starting a new session. After calibration is complete, the user will then click the finished calibration button which will trigger the distraction detection script.

After the initial testing of different facial recongition models, I have began implementation of the facial recognition module for our app. So far, the script will run facial recognition on the detected faces and print to the terminal if the user was recognized and the timestamp. The recognition runs around every one second, but this may need to be modified to improve performance.

I also began testing that the distraction detection works on users other than myself. Sleep, yawn, and gaze detection have performed very well on Arnav and Rohan, but we are running into some issues getting phone detection to work on Arnav and Rohan’s computers. I will investigate this issue in the following week.

Overall, my progress is on track. Although I did not finish implementing facial recognition, I have got a good start and was able to focus on integration in preparation for the interim demo.

Facial recognition output and screenshot:

User recognized:  21:55:37
User recognized:  21:55:38
User recognized:  21:55:39
User not recognized:  21:55:40
User not recognized:  21:55:41
User not recognized:  21:55:49

Arnav’s Status Report for 3/30

This week, I made enhancements to the user interface and overall data presentation in preparation for the Interim Demo. 

I incorporated a graph into the React frontend to visualize the distraction data collected from yawning, sleep, and gazing detection. This interactive graph, built using the Chart.js library, dynamically displays the frequency of each type of distraction over the current session. Users can hover over the graph to see detailed statistics on the number of times each distraction has occurred as well as the exact time the distraction occurred. Currently, the graph displays all the data from the current session. 

To help users track the duration of their work or study sessions, I added a session timer to the webpage. This timer is displayed on the Current Session Page and starts automatically when the session begins and updates in real-time.

I also created a calibration page that allows a distinction between the Calibration and the Current Session page. This page features a simple interface with a green button that, when clicked, triggers the run.py Python script to start the OpenCV face detection process. This calibration step ensures that the distraction detection algorithms are finely tuned to the user’s current environment and camera setup.

To provide more comprehensive session summaries, I modified the data payload structure to include a “frequency” item. This addition stores the number of times each type of distraction occurred during the session. Once the user decides to stop the current session, they will be routed to the Session Summary Page which displays statistics on their distraction frequencies. 

Lastly, I worked with Rohan on integrating the EEG data into the Session Summary page. Leveraging Django REST API endpoints, we enabled the real-time display of EEG data. We created an EEGEvent model that stores the epoch_timestamp, formatted_timestamp, and all the relevant data needed to display the flow state detection for the user. 

The Current Session Page, Session Summary Page, and Calibration Page look like the following:

(A window pops up for the calibration when the user is on this page. This is not displayed in the picture above.)

My overall progress is doing great and I am on schedule. This week I will continue to work with Rohan to display the EEG data on the frontend in the Current Session and Session Summary Pages. The plan is to make a pie chart of the time the user is in a flow state vs. not in a flow state and also display this information in a graph format.