This week I worked on some further experimentation with the flow state model. I tested out different configurations of training, validation, and test sets. I also experimented with adjusting the size of the model to see if we could learn the training data without overfitting such that the model can generalize to new data. Regardless of the training, validation, test splits and the size of the model, I was unable to improve the performance on unseen data which indicates we likely just need more recordings with new individuals as well as with the same people over multiple days. I also realized that the way I was normalizing the data in training, validation, and test set evaluation was different than the process I implemented for normalization during inference. So, I have been working with Arnav and Karen to resolve this issue which also introduces a need for an EEG calibration phase. We have discussed a few possible approaches for implementing this and also have a backup plan to mitigate the risk of the calibration not working out which would make it possible for us to make inferences without any calibration if necessary. My progress is on schedule and mainly will involve last minute testing to ensure we are ready for our demo on Friday next week.
Team Status Report for 4/20
This week we have all been mainly working on the final stages of our individual parts of the project and are also working on adding information to the final presentation slides this Monday. Karen and Arnav are working on finishing up the last couple of features of the project and ensuring that all the data looks visually presentable for the presentation and demo. Rohan has spent a lot of time this week collecting EEG flow state data with Professor Dueck and also working on training models for the focus state detection so that we can show both the flow state and focus state on the application.
We have all the software and hardware components integrated and have all the data we need to display on the application. The most significant risk right now is our EEG based brain state detection models for flow and focus classification. Our plan for mitigating this risk has been to collect more data in the past week and run more comprehensive validation tests to understand where the models are performing well and where they are performing poorly. Now that we have done more validation of the models, we can determine whether we need to collect more data or if we should spend time tweaking model parameters to improve performance. We can also use the SHAP explainability values to sanity check that our models are picking up on reasonable features.
Rohan’s Status Report for 4/20
This week I spent most of my time outside of classes working with Professor Dueck and her collaborative pianists and singers to collect more flow state data and I also collected focus/distracted data with Karen. I retrained both the flow and focus state models with the new data and re-ran the Shapley value plots to see if the models are still picking up on features that match existing research. Our flow state model is now trained on 5,574 flow data points and 7,778 not in flow data points and our focus state model is trained on 11,000 focused data points and 9,000 distracted data points.
The flow state model incorporates data from 6 recordings of I-Hsiang (pianist), 7 recordings of Justin (pianist), and 2 recordings of Rick (singer). I evaluated the model performance against 3 test sets:
The first one is pulled from data from the recordings used in training but the data points themselves were not included in the training set.
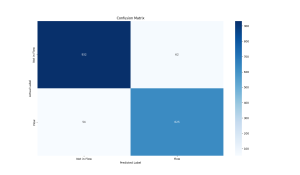
Precision: 0.9098
Recall: 0.9205
F1 Score: 0.9151
The second test set was from a recording of Elettra playing the piano which was not included in the training set at all.
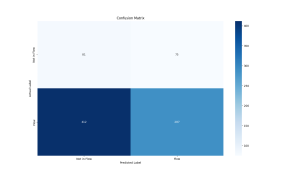
Precision: 0.7928
Recall: 0.4106
F1 Score: 0.5410
The third test set was from two recordings of Ricky singing which were not included in the training set at all.
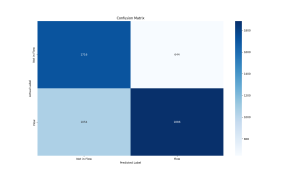
Precision: 0.7455
Recall: 0.6415
F1 Score: 0.6896
The focus state model incorporates data from 2 recordings of Rohan, 4 recordings of Karen, and 2 recordings of Arnav. I evaluated the model performance against 3 test sets:
The first one is pulled from data from the recordings used in training but the data points themselves were not included in the training set.
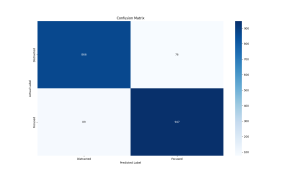
Precision: 0.9257
Recall: 0.9141
F1 Score: 0.9199
The second test set was from two recordings of Karen which were not included in the training set at all.
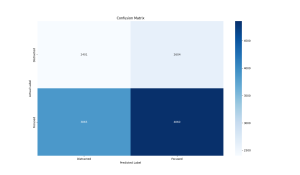
Precision: 0.6511
Recall: 0.5570
F1 Score: 0.6004
The third test set was from two recordings of Ricky singing which were not included in the training set at all.
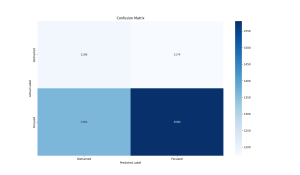
Precision: 0.5737
Recall: 0.5374
F1 Score: 0.5550
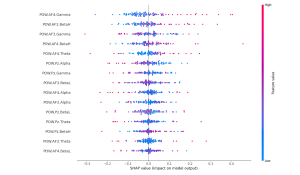
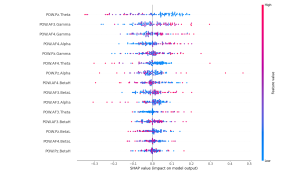
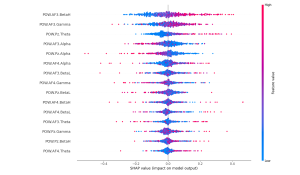
Finally, I reran the Shapley values for both the flow and focus state models and found that the features they are picking up still match up with existing research on these brain states. Furthermore, features that are particularly prominent in flow states such as theta waves are contributing heavily to a classification of flow in the flow state models but is contributing strongly towards a classification of non-focus in the focus state model which is very interesting because it demonstrates that the models are picking up on the distinction between flow and focus brain states.
Flow Shapley values:
Focus Shapley values:
As I have worked on this project I have learned a lot about the field of neuroscience and the scientific process used in neuroscience experiments/research. I have also learned about the classical opera music world and how to do applied machine learning to try to crack unsolved problems. It has been particularly interesting to bring my expertise in computing to an interdisciplinary project where we are thinking about machine learning, neuroscience, and music and how this intersection can help us understand the brain in new ways. The primary learning strategy I have used to acquire this new knowledge is to discuss my project with as many people as possible and in particular those who are experts in the fields that I know less about (i.e. neuroscience and music). I give frequent updates to Professor Grover and Professor Dueck who are experts in neuroscience and music respectively and have offered significant guidance and pointers to books, papers, and other online resources which have taught me a lot. I have also learned what it is like working on an open-ended research project on a problem that is currently unsolved as opposed to implementing something which has already been done before.
Rohan’s Status Report for 4/6
This week, I focused on flow state validation, developing/validating a focus detector, and applying Shapley values to provide explainability to our black box flow state neural network.
For the flow state detection validation, I wore noise canceling headphones while playing Fireboy and Watergirl which is a simple online video game for 15 minutes. Then, for the next 15 minutes, I worked on implementing the model validation script without noise canceling headphones with ambient noises in the ECE work space and frequent distractions from Karen. At the end, we looked at the percentage of time the model classified as in flow for each recording and saw that .254% of the intended flow state recording was marked as flow and .544% of the intended not in flow state recording was marked as flow. These results obviously are not what we expected, but we have a few initial thoughts as to why this may be the case. First of all, Fireboy and Watergirl is a two person game and I was attempting to play by myself which was much more difficult than I expected and definitely not second nature to me (necessary condition to enter flow state). As such, we plan to test our flow state model on my roommate Ethan who plays video games frequently and apparently enters a flow state often while playing. By validating the model on an activity that is more likely to actually induce a flow state, we expect to see better results. If this ends up not working, we plan to return to the music setting and see how the model performs on the pianists we trained it on and then test on pianists we have not trained on before to further understand where the model may be overfitting.
I also developed a focus detection system which was trained on focused and distracted recordings of Arnav, Karen, and myself. We validated this data by collecting another set of focused and distracted data on Karen, but unfortunately this also had poor results. For the focused recording, our model predicted that 12.6% of the recording was in focus and for the distracted recording, it predicted that 12.3% of the recording was in focus. I realized soon after that the training set only had 34 high quality focus data points of Karen compared to 932 high quality distracted data points. This skew in the data is definitely a strong contributor to our model’s poor validation performance. We plan to incorporate this validation data into the training set and retry validating this coming week. As a backup, we inspected the Emotiv Focus Performance Metric values on this data and saw a clear distinction between the focus and distracted datasets which had average values of .4 and .311 respectively on a range from 0 to 1.
Finally, I applied Shapley values to our flow state model to ensure that our model was picking up on logical features and not some garbage. The SHAP package has a wide variety of functionality, but I specifically explored the KernelExplainer Shapley value approximater and the summary_plot function to visualize the results. Because computing Shapley values over a large dataset, even via approximation methods, can be extremely computationally intensive, I randomly select 500 samples from the dataset to compute the Shapley values on. The basic summary plot shows the contribution each feature makes on each of the 500 points towards a classification of flow. The bar summary plot shows the mean absolute contribution of each feature to the output classification in either direction (i.e. flow or not in flow). We see that the High Beta and Gamma frequency bands from the AF3 sensor (prefrontal cortex) as well as the Theta frequency band from the Pz sensor (parietal lobe) have high impact on the model’s classification of flow vs. not in flow state. These plots allow us to better understand which parts of the brain and more specifically, which EEG frequency bands have the most correlation with flow states in the music setting. Because flow states are difficult to induce and detect with high granularity, having access to high quality flow state ground truth from Professor Dueck is extremely valuable. Given her extensive experience with detecting flow states, and Shapley values’ ability to explain the contributions of each input to the final output, we can make new progress in understanding what kinds of brain activity corresponds with flow states.
Basic Summary Plot:
Bar Summary Plot:

Team Status Report for 3/30
We have made significant progress with the integration of both camera based distraction detection and our EEG focus and flow state classifier into a holistic web application. At this point, we have all of the signal processing of detecting distractions by camera and identifying focus and flow states via EEG headset working well locally. Almost all of these modules have been integrated into the backend and by the time of our interim demo, we expect to have these modules showing up on the frontend as well. At this point, the greatest risks are mainly to do with our presentation of our technology not doing justice to the underlying technology we have built. Given that we have a few more weeks before the final demo, I think that we will be able to comfortably iron out any kinks in the integration process and figure out how to present our project in a user-friendly way.
While focusing on integration, we also considered and had some new ideas regarding the flow of the app as the user navigates through a work session. Here is one of the flows we have for when the user opens the app to start a new work session:
- Open website
- Click the new session button on the website
- Click the start calibration button on the website
- This triggers calibrate.py
- OpenCV window pops up with a video stream for calibration
- Press the space key to start neutral face calibration
- Press the r key to restart the neutral face calibration
- Press the space key to start yawning calibration
- Press the r key to restart the neutral face calibration
- Press the space key to start yawning calibration
- Press the r key to restart the yawning face calibration
- Save calibration metrics to a CSV file
- Press the space key to start the session
- This automatically closes the window
- This triggers calibrate.py
- Click the start session button on the website
- This triggers run.py
Rohan’s Status Report for 3/30
This week, in preparation for our interim demo, I have been working with Arnav to get the Emotiv Focus Performance Metric and the Flow State Detection from our custom neural network integrated with the backend. Next week I plan to apply Shapley values to further understand which inputs are contributing most significantly in the flow state classification. I will also test out various model parameters, trying to determine the lower and upper bounds on model complexity in terms of the number of layers and neurons per layer. I also need to look into how the Emotiv software computes the FFT for the power values within the frequency bands which are the inputs to our model. Finally, we will also try training our own model for measuring focus to see if we can detect focus using a similar model to our flow state classifier. My progress is on schedule and I was able to test the live flow state classifier on myself while doing an online typing tests and saw some reasonable fluctuations in and out of flow states.
Rohan’s Status Report for 3/23
In order to better understand how to characterize flow states, I had conversations with friends in various fields and synthesized insights from multiple experts in cognitive psychology and neuroscience including Cal Newport and Andrew Huberman. Focus can be seen as a gateway to flow. Flow states can be thought of as a performance state; while training for sports or music can be quite difficult and requires conscious focus, one may enter a flow state once they have achieved mastery of a skill and are performing for an audience. A flow state also typically involves a loss of reflective self-consciousness (non-judgmental thinking). Interestingly, Prof. Dueck described this lack of self-judgment as a key factor in flow states in music, and when speaking with a friend this past week about his experience with cryptography research, he described something strikingly similar. Flow states typically involve a task or activity that is both second nature and enjoyable, striking a balance between not being too easy or tedious while also not being overwhelmingly difficult. When a person experiences a flow state, they may feel a more “energized” focus state, complete absorption in the task at hand, and as a result, they may lose track of time.
Given our new understanding of the distinction between focus and flow states, I made some structural changes to our previous focus and now flow state detection model. First of all, instead of classifying inputs as Focused, Neutral, or Distracted, I switched the outputs to just Flow or Not in Flow. Secondly, last week, I was only filtering on high quality EEG signal in the parietal lobe (Pz sensor) which is relevant to focus. Here is the confusion matrix for classifying Flow vs Not in Flow using only the Pz sensor:

Research has shown that increased theta activities in the frontal areas of the brain and moderate alpha activities in the frontal and central areas are characteristic of flow states. This week, I continued filtering on the parietal lobe sensor and now also on the two frontal area sensors (AF3 and AF4) all having high quality. Here is the confusion matrix for classifying Flow vs Not in Flow using the Pz, AF3, and AF4 sensors:

This model incorporates the Pz, AF3, and AF4 sensors data and classifies input vectors which include overall power values at each of the sensors and within each of the 5 frequency bands at each of the sensors into either Flow or Not in Flow. It achieves a precision of 0.8644, recall of 0.8571, and an F1 score of 0.8608. The overall accuracy of this model is improved from the previous one, but the total amount of data is lower due to the additional conditions for filtering out low quality data.
I plan on applying Shapley values which are a concept that originated out of game theory, but in recent years has been applied to explainable AI. This will give us a sense of which of our inputs are most relevant to the final classification. It will be interesting to see if what our model is picking up on ties into the existing neuroscience research on flow states or if it is seeing something new/different.
My Information Theory professor, Pulkit Grover, introduced me to a researcher in his group this week who is working on a project to improve the equity of EEG headsets to interface with different types of hair, specifically coarse Black hair which often prevents standard EEG electrodes from getting a high quality signal. This is interesting to us because one of the biggest issues and highest risk factors of our project is getting a good EEG signal due to any kind of hair interfering with the electrodes which are meant to make skin contact. I also tested our headset on a bald friend to understand if our issue with signal quality is due to the headset itself or actually because of hair interference. I found that the signal quality was much higher on my bald friend which was very interesting. For our final demo, we are thinking of inviting this friend to wear the headset to make for a more compelling presentation because we only run the model on high quality data, so hair interference with non-bald participants will end up with the model making very few predictions during our demo.
Team Status Report for 3/16
This week, we ran through some initial analysis of the EEG data. Rohan created some data visualizations comparing the data during the focused vs. neutral vs. distracted states labeled by Professor Dueck. We were looking at the average and standard deviations of power values in the theta and alpha frequency bands which typically correspond to focus states to see if we could see any clear threshold to distinguish between focus and distracted states. The average and standard deviation values we saw as well as the data visualizations made it clear that a linear classifier would not work to distinguish between focus and distracted states.
After examining the data, another consideration we realized was that Professor Dueck labeled the data with very high granularity, as she noted immediately when her students exited a flow state. This could be for a period as short as one 1 second as they turn a page. We realized that while our initial hypothesis was that these flow states would correspond closely to focus states in the work setting was incorrect. In fact, we determined that focus state is a completely distinct concept from flow state. Professor Dueck recognizes a deep flow state which can change with high granularity, whereas focus states are typically measured over longer periods of time.
Based on this newfound understanding, we plan to use the Emotiv performance metrics to determine a threshold value for focus vs distracted states. To maintain complexity, we are working on training a model to determine flow states based on the raw data we have collected and the flow state ground truth we have from Professor Dueck.
We were able to do some preliminary analysis on the accuracy of Emotiv’s performance metrics, measuring the engagement and focus metrics of a user in a focused vs. distracted setting. Rohan first read an article while wearing noise-canceling headphones and minimal environmental distractions. He then completed the same task without more ambient noise and frequent conversational interruptions. This led to some promising results: the metrics had a lower mean and higher standard deviation in the distracted setting compared to the focused setting. This gives us some confidence that we have a solid contingency plan
There are still some challenges with using the Emotiv performance metrics directly. We will need to determine some thresholding or calibration methods to determine what is considered a “focused state” based on the performance metrics. This will need to work universally across all users despite the actual performance metric values potentially varying between individuals.
In terms of flow state detection, Rohan trained a 4 layer neural network with ReLU activation functions and a cross-entropy loss function and was able to achieve validation loss significantly better than random chance. We plan to experiment with a variety of network configurations, changing the loss function, number of layers, etc. to see if we can further improve our model’s performance. This initial proof of concept is very promising and could allow us to detect elusive flow states using EEG data which would have applications in music, sports, and traditional work settings.
Our progress for the frontend and backend, as well as camera-based detections, is on track.
After working through the ethics assignment this week, we also thought it would be important for our app to have features to promote mindfulness and make an effort for our app to not contribute to an existing culture of overworking and burnout.
Rohan’s Status Report for 3/16
This week I tried to implement a very simple thresholding based approach to detect flow state. Upon inspecting the average and standard deviation for the theta and alpha (focus related frequency bands) I saw that there was no clear distinction between the flow states and there was very high variance. I went on to visualize the data to see if there was any visible linear distinction between flow states, which there were not. This told me that we would need to introduce some sort of non-linearity into our model which led me to implement a simple 4-layer neural network with ReLU activation functions and cross-entropy loss. The visualizations are shown below. One of them uses the frontal lobe sensors AF3 and AF4 and the other uses the parietal lobe sensor Pz. The plots show overall power for each sensor and then the power values for the theta and alpha frequency bands at each sensor. On the x-axis is time and the y-axis is power. The green dots represent focused, red is distracted, and blue is neutral.


When I implemented this model, I trained it on only Ishan’s data, only Justin’s data, and then on all of the data. On Ishan’s data I saw the lowest validation loss of .1681, on Justin’s data the validation loss was a bit higher at .8485, and on all the data the validation loss was .8614 all of which are better than random chance which would yield a cross entropy loss of 1.098. I have attached the confusion matrices for each dataset below in order. For next steps I will experiment with different learning rates, using AdamW learning rate scheduling instead of Adam, try using more than 4 layers, different activation functions, only classifying flow vs not instead of neutral and distracted separately, and using a weighted loss function such as focal loss.


Overall my progress is ahead of schedule, as I expected to have to add significantly more complexity to the model to see any promising results. I am happy to see performance much better than random chance with a very simple model and before I have had a chance to play around with any of the hyperparameters.
Rohan’s Status Report for 3/9
This week I spent a couple hours working with Arnav to finalize our data collection and labeling system to prepare for our meeting with Professor Dueck. Once this system was implemented, I spent time with two different music students to get the headset calibrated and ready to record the raw EEG data. Finally, on Monday and Wednesday I brought it all together with the music students and Professor Dueck to orchestrate the data collection and labeling process. This involved getting the headset set up and calibrated on each student, helping Professor Dueck get the data labeling system running, and observing as the music students practiced and Professor Dueck labeled them as focused, distracted, or neutral. I watched Professor Dueck observe her students and tried to pick up on the kinds of things she was looking for while also making sure that she was using the system correctly/not encountering any issues.
I also spent a significant amount of time working on the design report. This involved doing some simple analysis on our first set of data we collected on Monday and making some key design decisions. Once we collected data for the first time on Monday, I looked through the EEG quality on the readings and found that we were generally hovering between 63 and 100 on overall EEG quality. Initially, I figured we would just live with the variable EEG quality, and go forward with our plan to pass in the power readings from each of the EEG frequency bands from each of the 5 sensors in the headset as input into the model and also add in the overall EEG quality value as input so that the model could take into account EEG quality variability. However, on Wednesday when we went to collect data again, we realized that the EEG quality from the two sensors on the forehead (AF3 and AF4) tended to be at 100 for a significant portion of the readings in our dataset. We also learned that brain activity in the prefrontal cortex(located near the forehead) is highly relevant to focus levels. This led us to decide to only work with readings where the EEG quality for both the AF3 and AF4 sensors were 100 and therefore avoid having to pass in the EEG quality as input into the model and depend on the model learning to account for variable levels of SNR in our training data. This was a key design decision because it means that we can have much higher confidence in the quality of our data going into the model because according to Emotiv, the contact quality and EEG quality is as strong as possible.
My progress is on schedule, and this week I plan to link the raw EEG data with the ground truth labels from Professor Dueck as well as implement an initial CNN for focus, distracted, or neutral state detection based on EEG power values from the prefrontal cortex. At that point, I will continue to fine tune the model and retrain as we accumulate more training data from our collaboration with Professor Dueck and her students in the School of Music.
