Team Status Report for 4/27

Risk Mitigation 

Our biggest risk this week is being able to test enough and fine tune our system for accuracy. We want to collect a variety of data in order to make sure our system is robust and we are able to include the relevant information in our final poster and report. We plan on going to test at Salem’s almost every day this week, going at different times (sometimes in the morning to get data for when there are fewer people around, and sometimes at night from around 5-8 PM, where traffic is greater). This way we will have a variety of different tests to show for when it is time to write about testing in the final report. 

Design Changes 

We are exploring another way to measure throughput, instead of using our original camera angle which some cashiers were uncomfortable with, we are looking into a different camera angle (instead of overhead, we are looking into an angle that is on/near the conveyor belt). However, this change is not final yet. 

Schedule Changes 

We have no schedule changes as of this week. 

Tests 

Below are some results from testing the upload and download time when recording different length videos. Interestingly, there is a spike in upload time from 2 to 3 seconds, but the internet that this was tested on (Brian’s) is spotty, so that might have to do with the abrupt increase. Also, upload and download times remain quite stagnant from 5 second to 6 second videos. Based on these results, we figured it would be best to use 2 second videos, as the upload and download time seem to work best for meeting our latency constraints (< 5 seconds to compute a result after initially processing the video feed). It would be possible to go up to 4 second videos, but the spike from 2 to 3 second videos is a deterrent. 

Duration Upload Time (Averaged over 10 trials)  Download Time (Averaged over 10 trials)
1 second 0.61s 0.32 s
2 seconds 0.92 s 0.47 s
3 seconds 1.35 s 0.53 s 
4 seconds 1.52 s 0.55 s 
5 seconds 1.61 s  0.57 s
6 seconds 1.65 s 0.59 s
7 seconds 1.80 s 0.68 s 
8 seconds 1.92 s 0.72 s
9 seconds 2.21 s 0.76 s
10 seconds 2.3 s 0.88 s 

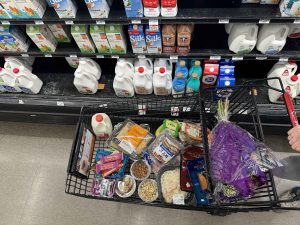
In terms of testing relative fullness, we have tested with various different pictures and footage from Salem’s in order to check the accuracy of the module. From these results, we determined that fullness calculations need a bit of tweaking in order to increase the accuracy. The module performs especially poorly with a very full cart as shown below. We have tried to decrease the Gaussian blur, which has increased the accuracy for these very full carts to a degree, but the calculations are still a bit unreliable, so we will need to adjust accordingly.


Team Status Report for 4/20

Risk Mitigation 

A risk for us with gathering test data is making sure that we can go at times where there is a decent amount of traffic at Salem’s and we can get a sufficient amount of testing data. We have already went to Salem’s a few times where it wasn’t busy enough to set up three checkout lanes. The way we are mitigating this is by going to test our system near peak hours instead of too early in the morning on a weekday where only 1 or 2 checkout lanes are available. Furthermore, if we do go at a lower traffic time, we want it to be a time where there are at least 2 checkout lanes running because we want to at least have enough traffic to have our system compute the speeds of two different lanes and compare them properly. 

Design Changes 

We haven’t made any changes to our design. 

Schedule Changes 

We haven’t made changes to our schedule as of this week, since we already have a day-to-day schedule. 

Team Status Report for 4/6

Risk Mitigation 

A risk in our project that we are trying to mitigate at the moment is whether or not our intended platform for storing data will be sufficient in terms of upload/download speed. Since we are planning on uploading camera footage from Salem’s and immediately using it and discarding it in real time, it is necessary to make sure that the platform we choose can be fast enough to allow for this data transfer from RPi to laptop to work properly. Therefore, we will test with uploading data from our RPis to cloud with AWS S3 buckets, and if those do not meet our requirements, then we can pivot to Dropbox or other distributed storage alternatives. 


Design Changes

Since we are using RPis to use real-time data from Salem’s, we are using AWS as a middleman in the content delivery process from the store to our remote laptops, which can then use the data for testing purposes on our system. 

Schedule Changes 

We have created a rough draft schedule for the last few weeks of the semester to stay on track: 


Brian Shubhi Simon
April 3rd, 2024, Wed Fix environment for cv2.imshow, look into options for RPi data transfer Purchase requests for cameras/displays/RPis RPi setup 
April 4th, 2024, Thursday Fix environment for cv2.imshow/RPi setup Talk to Salem’s about using their Cameras, Wifi, installing our own cameras, reimplement fullness acquisition RPi setup 
April 5th, 2024, Friday RPi setup, set up server/method for data uploading from RPi Reimplement fullness acquisition RPi access camera module and USB camera simultaneously 
April 6th, 2024, Saturday Set up server/method for data uploading from RPi Reimplement fullness acquisition RPi access camera module and USB camera simultaneously 
April 7th, 2024, Sunday Set up server/method for data uploading from RPi, test uploading multiple cameras data per raspberry pi, implement fetching Improve accuracy of fullness acquisition RPi access camera module and USB camera simultaneously, test uploading multiple cameras data per raspberry pi, implement fetching
April 8th, 2024, Monday Go to Salem’s, add pictures to dataset to train for throughput, implement line detection Go to Salem’s, improve accuracy of fullness acquisition Go to Salem’s, implement line detection, add pictures to dataset to train for throughput acquisition
April 9th, 2024, Tuesday Implement line detection, retrain throughput model Improve accuracy of fullness acquisition Implement line detection
April 10th, 2024, Wednesday Implement line detection, retrain throughput model Improve accuracy of fullness acquisition Implement line detection
April 11th, 2024, Thursday Increase accuracy of throughput acquisition, go to Salem’s and install cameras Increase accuracy of throughput acquisition, go to Salem’s and install cameras Increase accuracy of throughput acquisition, go to Salem’s and install cameras
April 12th, 2024, Friday Test throughput, line, fullness acquisition with footage from Salem’s Test throughput, line, fullness acquisition with footage from Salem’s Test throughput, line, fullness acquisition with footage from Salem’s
April 13th, 2024, Saturday Test throughput, line, fullness acquisition with footage from Salem’s Test throughput, line, fullness acquisition with footage from Salem’s Test throughput, line, fullness acquisition with footage from Salem’s
April 14th, 2024, Sunday Test throughput, line acquisition with footage from Salem’s, integrate line detection Test throughput, line acquisition with footage from Salem’s, integrate line detection Test throughput, line acquisition with footage from Salem’s, integrate line detection
April 15th, 2024, Monday Integrate line detection, purchase toy carts, prop items, test integrated system Integrate line detection, test integrated system Integrate line detection, test integrated system
April 16th, 2024, Tuesday Test integrated system Test integrated system Test integrated system
April 17th, 2024, Wednesday Test integrated system Test integrated system Test integrated system
April 18th, 2024, Thursday Figure out test configuration for final demos, dry runs with test configuration  Figure out test configuration for final demos, dry runs with test configuration  Figure out test configuration for final demos, dry runs with test configuration 
April 19th, 2024, Friday Slack Slack Slack
April 20th, 2024, Saturday Slack Slack Slack
April 21st, 2024, Sunday Slack Slack Slack
April 22nd, 2024, Monday, FINAL PRESENTATION
April 23rd, 2024, Tuesday
April 24th, 2024, FINAL PRESENTATION


Testing 

Using data from Salem’s market, we plan on validating our system by setting up our system there, letting it run, and observing how frequently it is the case that an individual that uses the system before the next one gets out of the store or to the checkout line faster. We will then tally the total number of users that are able to get to the front of a checkout line or out of the store faster and divide it by the total number of users in order to measure accuracy. Furthermore, for testing the speed of the system, we can programmatically check how fast the system is from start of computation to displaying the result, and check if it is under our design requirements. 

Team Status Report for 3/30

Risk Mitigation 

A notable risk for our project is being able to have testing data. We are combating this risk by using RPis in order to take camera footage and store chunks of it in order to use for testing. Since we have gotten approval to test our project at Salem’s Market, we will fortunately be able to accomplish this. 


Design Changes

We are now for each checkout line adding a RPi in order to take the camera footage and store it for usage in testing. 


Schedule Changes 

Nothing has changed from last week in terms of our schedule, our Gantt Chart remains unchanged


Team Status Report for 3/23

Risk Mitigation

One of the biggest risks for our project is testing our software modules and making sure they individually work prior to integration. To combat this, we will be going to grocery stores and taking video footage in order to test our modules. OpenCV makes it very easy to read video files and so this allows us to test our individual modules without having to set things up live. For throughput calculations, we plan on taking video footage of store items moving on the checkout line conveyor belts and processing the footage via our code to check if the calculated throughput makes sense. Similarly, we will take videos of carts moving in the grocery store in order to test our other modules when we finish implementing them. 


Design Changes

Nothing has changed about our design as of this week, however, we are considering changing what the throughput calculating module inputs into the database: instead of just storing a calculated throughput, we will store item count and time elapsed in order to more easily keep count of a running average. 


Schedule Changes 

Nothing has changed about our schedule, our Gantt chart remains the same as before. 


Team Status Report for 3/16

Risk Mitigation

Now that we are training several models to go through with our CV algorithms, we realized that due to time constraints, it is imperative that we get this done as soon as possible. To do this, we are using YOLOv8, which is very user friendly, and we are training models from datasets that are publicly available whenever possible. For example, we are training models from datasets of shopping carts that are publicly available and of datasets of grocery store items that are publicly available in order to save time. 


Design Changes

Nothing has changed about our design. We are still implementing throughput calculations for cashiers, relative fullness calculations for carts, and detecting how many people are lined up in the same manner as was determined before spring break in our design report. 


Schedule Changes

Our Gantt chart remains unchanged from before. 


Team Status Report for 3/9

Risk Mitigation

One vital part of our product solution is determining the relative fullness of a shopping cart using an edge detection algorithm. Edge detection can be potentially inaccurate, but it is the most important part of our calculation for figuring out which checkout line is the fastest, and therefore we need to minimize the amount of error in this case. Therefore, if our preliminary edge detection algorithm implementation has a larger error rate than wanted for figuring out the relative fullness of a cart, we will purchase more cameras (3 more, 1 extra camera per checkout line). We have enough budget to do this, and so it should allow us to achieve a higher accuracy rate with our edge detection algorithm given the extra camera angle to gather data. 

Design Changes

We made many changes this week due to fleshing out our design. The most important change we made was eliminating the use of an FPGA in our project. We realized that speed isn’t a stringent requirement for our needs (we care about accuracy the most), and therefore we decided to just run the backend entirely on a laptop. 

Furthermore, instead of detecting the number of items in a cart, which is error prone and very inaccurate, we are planning to use edge detection to instead estimate the relative fullness of a shopping cart and then use a metric of sorts to determine the approximate amount of time it would take to check out a cart that is x% full. 

We are planning on changing our programming language of choice to Python from C++ because of our choice to leave out FPGAs from our design. Python will be much simpler to understand and code reviews will be more quick with this change. Looking into OpenCV, we observed that writing in Python does not generate much overhead compared to a C++ implementation of the same function, and so our change should not incur any unwanted performance issues. 

Schedule 

We’ve changed our schedule because of our decision to change our design to no longer incorporate an FPGA. Now Simon is working on software modules. Here is our Gantt chart: 

Part A: Grocery stores are all over the world and an essential part of people’s lives. With our product solution, people will have a more streamlined and efficient shopping experience, waiting for a shorter period of time to check out of a store. Waiting much less time will help people spend less time at the grocery store and allocate more time for their other priorities. 


Part B: Our product solution emphasizes the need for a timely and more efficient grocery shopping experience. Today’s society is greatly motivated by fast paced lifestyles and convenient solutions, which our system design caters to. With our system producing a timely result to users, we expedite the shopping process for customers who are on a time crunch and have other priorities that they want to spend their time on. Our system uses algorithms that analyze the queue length and cashier speed to cater to the cultural value of time optimization. We can see across many cultures that time optimization is important and multiple cultures have even put efforts towards creating tools and innovations that revolutionize the efficiency of daily operations. Additionally, our system is inclusive for different cultures where people might not necessarily understand the same language, but since we only deal with numbers, we are able to cater to multiple groups of people.


Part C: We don’t believe our product solution will have any significant impact on the environment. The only related aspect is the electricity the cameras and laptop will use, but compared to the cost of lighting and climate control for a grocery store, this will be negligible. Grocery stores use roughly 50 kWh of electricity per square foot per year and the average grocery store is 40k square feet, while a camera uses around 10 kWh per year, a standard laptop uses 450 kWh per year, and a small monitor uses around 500 kWh per year. Assuming a reasonable number of cameras (<100), the increase in electricity consumption will be less than 0.1% by my estimates. 


Part A was written by Brian, Part B was written by Shubhi, Part C was written by Simon 


Team Status Report for 2/24

Risk Mitigation

While we don’t have too much currently planned for our budget, it is imperative that we use it wisely when ordering cameras because of our design. Our design uses two cameras per checkout line, which gets very costly as we order more cameras to complete our system integration later in the semester. Therefore, we are currently just ordering one camera for testing and then we can change our camera if hardware requirements aren’t met, and not spend too much budget on this.


Design 

There were no design changes made to our system as of now. However, we are discussing what we need to do to handle choosing the correct frames in the real-time video footage we are receiving in order to not process redundant data, and how to handle the line decreasing in size.


Schedule

Our Gantt chart has not changed overall as of this week.


Team Status Report for 2/17

We spent part of this week talking about potentially changing the system to include a different type of sensor to observe the number of items in every cart. After discussing with our faculty advisor and talking between each other, we decided against it since it would have been an additional effort to integrate it into our system, something we didn’t think was worth it. As a team, we spent the rest of the week fleshing out and implementing the architecture of our system while also working on the design review slides. 


After doing some more research into how OpenCL works, we realized that OpenCL converts kernel code (C/C++) into RTL and synthesizes it, in which case our Gantt chart needs to be modified. Now, our schedule has a dependency where we need to have an algorithm in OpenCV, then find the portion of the code that needs to be sped-up, and make a C/C++ implementation from Python so that we can accelerate it using OpenCL. Therefore, the allocation of tasks has changed and a few tasks have been shuffled/removed. Below is our revised Gantt chart:

A was written by Simon, B was written by Shubhi, C was written by Brian

Part A: Our system expedites the grocery shopping process, which hopefully alleviates some of the frustrations that might arise from having to wait in lines. With regard to public health, a more pleasant shopping experience could encourage people to shop for their own groceries more frequently, which tends to be healthier than eating at restaurants. This also benefits public welfare, since our system aims to make the basic need of buying groceries more convenient. Where safety is concerned, the use of cameras in our system could be concerning for the customers. However, the only data we aim to collect about people is the number of them (and not who is) in a line at a given time, and we will not be storing any significant amount of camera footage. Furthermore, people are already monitored in grocery stores through security cameras, so our additional cameras will not be capturing any information that wouldn’t already be known for security purposes.


Part B: Individuals are bound to have a better shopping experience where they are able to save time at the grocery store. People are more likely to return back to the grocery store and make more visits if they have a positive shopping experience, almost fostering a sense of community at the grocery store. Many demographics of people don’t get a lot of social interaction, such as the elderly, and a positive grocery store experience provides an opportunity to foster that sense of community and increase social interaction between such groups. Integrating a system that decreases the time it takes to get to the checkout counter also decreases the overall time a customer spends at the store, which is more time to spend elsewhere that can be directed to bettering society. 


Part C: Our system increases the speed at which customers are able to check out of the store, and this could allow for stores to become more popular due to customer satisfaction with checkout times. With increased popularity, a given store using our system could increase revenue and by extension profit. Also, with faster checkout times, a store might not need as many cashiers to man the counters, which would also increase store profits due to cost cutting.


Team Status Report for 2/10

Risk Identification and Mitigation Strategies

Primary Risk Concern: A major risk for this project is choosing an acceptable FPGA to support our hardware acceleration constraints. Which FPGA we choose is important, we want one that has enough logic elements to support our RTL implementation. 


Mitigation Strategies: 

To address this risk before any potential issues, we are planning on using an FPGA in the project inventory (we are planning on using the DE10-Standard at the moment since Cyclone V has much more support than Cyclone IV boards). Since there is only one of these boards in the project inventory at the moment, we can pivot to ordering another Cyclone V board online if the DE10-Standard is claimed by another team (we are considering this less costly FPGA: https://www.terasic.com.tw/cgi-bin/page/archive.pl?Language=English&CategoryNo=218&No=1021&PartNo=2#contents). This will be a significant portion of our budget but our required items for purchase are not as expensive as this FPGA, so we will still be well within budget even if we need to purchase another FPGA. 


Design Changes: 

Although we have not made changes to our design yet and will continue to discuss this on Monday, we are working to incorporate feedback from our proposal. We are considering changing our design to from being entirely wired to including wireless communication where necessary to improve our scalability. We are currently exploring our options still, but we are primarily looking at bluetooth. 


Schedule Change: 

After the proposal presentations, we realized that our Gantt chart wasn’t accounting for spring break, so we decided to change that and include a time for break. Note that the RTL implementation task likely will not be worked on during spring break, but we thought that it wouldn’t be as clear if we separated the same task into two different tasks.