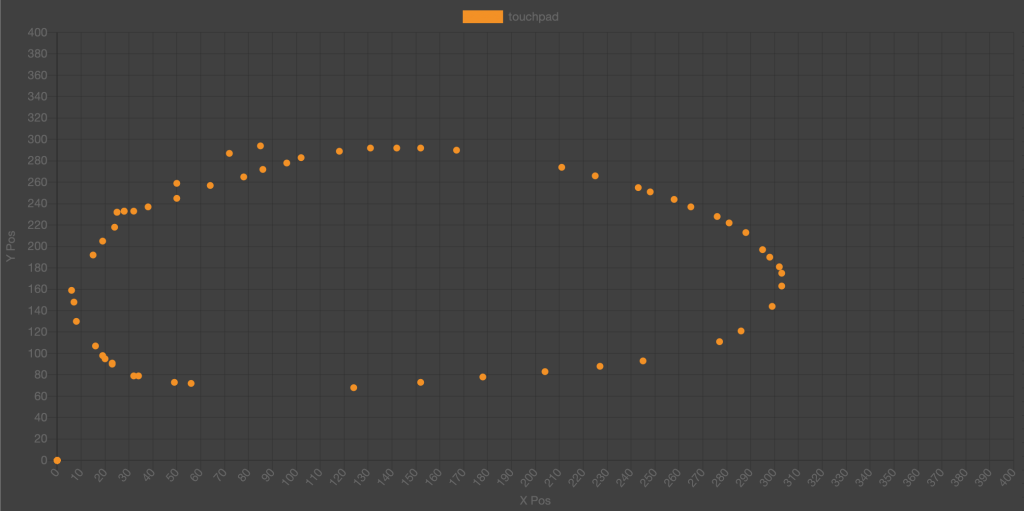
This week I continued working on the sensor data visualization tool. I was able to extend it to the gyroscope and touchpad sensors. Drawing a circle on the touchpad (without pressing down on the buttons) gave this output:

There would be some further calibration needed if we wanted to fine tune spacial detection on the touchpad, but for the purposes of swipes, it worked rather well. I began working on finding gestures from these datasets and decided to continue working on the tool as I needed. With gestures, I was able to see distinct peaks and troughs in acceleration values when I would physically do a sharp movement indicative of a note change. The main issue was that the data was coming in one point at a time, so we would need to find a way of analyzing realtime time series data.
I found an article on doing this, and will try implementing a similar sliding window algorithm.
https://pdfs.semanticscholar.org/1d60/4572ec6ed77bd07fbb4e9fc32ab5271adedb.pdf
