Team Status Report for 12.09.23

The most significant risks right now are regarding integration and testing. For integration, as we finalize our ML models we don’t have as much time as we might want when it comes to debugging. This week we have been running into many issues with integrating our systems, whether it has to do with incompatibilities, file path issues, or more. We will be working hard throughout the weekend and until the demo in order to finalize our integration. Along with this risk comes the risk of not having enough testing. If we don’t finish our integration in time, we will not be able to conduct thorough testing of our complete system, and also won’t be able to conduct thorough user testing. As mentioned last week, if we cannot test tomorrow we will likely have to test during the demo on Monday so that we can include our results in the final report.

We have not made any changes to the design of our system since last week, and have not updated our schedule.

For our latency tests, we measured the time between the button press for starting/stopping audio, and the result. We took 10 trials and averaged the results. For the start button latency, we measured an average of 5 seconds, and for the stop button latency, we measured an average of 60 ms. It is worth mentioning that these latencies are dependent upon the network delay and traffic at the time.

For our weight and size measurements, we simply used a scale and a ruler. The weight of our attachment was 86 grams, and the size was 76 mm by 42 mm by 37 mm.

For battery life, we measured a minimum battery life of 5 hours when the device was being used constantly. This was after testing the battery on 5 separate occasions.

For our graph detection ML model, we gathered around 2000 real images of lecture slides which we split into a training and validation set. The validation set had a size of about 100 images and our unit tests involved testing whether the graph detection model was able to detect good bounding boxes around graphs in the slides. To measure the accuracy of this, we used mean intersection over Union as a metric – calculating the overlap / total area of the predicted and true bounding boxes from what we labeled. We found that all graphs were accurately detected (100% detection rate) and the mean IOU was about 95%, so bounding boxes were pretty good about capturing the whole graph.

For our slide matching ML model, unit testing involved taking a validation set of 110 images from the images of slides we captured with our device in TechSpark. We then tested both components of our slide matching system. First, we tested the detection of bounding boxes around the slide number on the slide. These numbers were detected with 100% accuracy. We then took the cropped images of the slide number boxes and then ran a second model on them in which we did preprocessing and then classification of each digit. These tests revealed an accuracy of 73%, so our total accuracy for slide matching from unit testing is 73%.

For our graph description ML model, our unit tests involved measuring the mean accuracy in terms of token-to-token matching with the reference descriptions. We did this on a set of about 75 graphs out of the graphs we extracted from real slides, and this revealed an accuracy of 96%.
Weekly Status Report for 12.02.23

The most significant risks that need to be mitigated is, again, our ML model accuracy, but now also our user testing. Our ML models are still currently not finished, and are not working at the level of accuracy we expected. However, we can mitigate this if absolutely necessary by allowing professors to provide written graph descriptions for each graph in their slide deck, then parsing these descriptions ourselves in order to output accurate descriptions. As for user testing, we want to try to have users test our product the following week, but this might not be viable because our integration is still not done. So, our mitigation plan is to collect data during the demo for our final report.

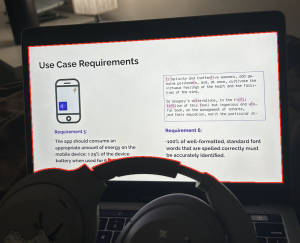
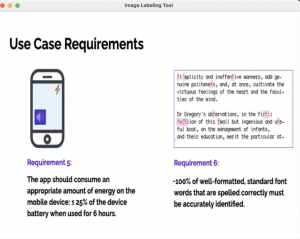
We changed the design of the system to require the professors to add bolded slide numbers with a red bounding box around them in order to increase the accuracy of our slide matching model, since without it, the slide matching model performed very poorly. We also limited our scope to just be line graphs and scatterplots because we did not have enough data or time to label new data for the other kinds of graphs. This would also increase the time we could spend on these two graphs, and thus produce a more accurate output.

No changes to the schedule.

See Nithya and Jaspreet’s status reports for images of the working slide matching ML model and 3D printed component case.

Team Status Report for 11.18.23

I think we have grown as a team in terms of many skills like communication, planning, and time management. Throughout the semester so far, one strategy we have started employing recently is setting regular times to meet outside of class to work on our project, even though what we have to work on is separate and does not necessarily require other teammates to complete. This makes us more accountable and productive and was particularly useful before our interim demo. For joint tasks like data collection, we also set specific goals for how many images we wanted to gather per day, and we were able to stick to that schedule. One final strategy is to ask for help early on – I think that earlier in the semester, when we got stuck on something, we would try for a long time to figure it out on our own, but with the end-of-semester deadlines approaching, we found that it is best to ask for help immediately to resolve any issues.

The most significant risk is still the ML models not working. The ML model we must have working for our final project is the slide detection model, which is necessary to get any sort of output from our app. It must be able to at least identify the slide and output the text on the slide, even if the graph data cannot be extracted. We have been managing this risk by taking a lot of images that we can use to train the model on, and have contingency plans involving taking more images later on if the model is not accurate enough. Similarly, we have a lot of data for the graph data extraction model, but they are all similarly formatted because we decided to auto-generate them through a python script. If need be, we can find another dataset online that contains pre-tagged graph data in order to make the training set more diverse.

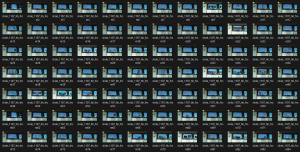
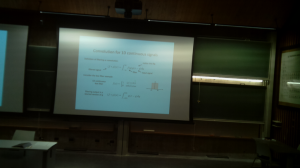
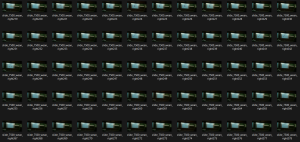
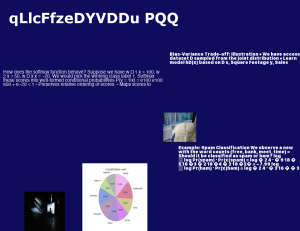
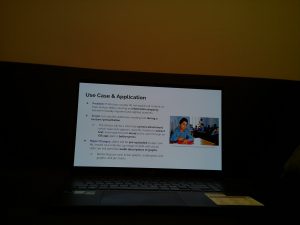
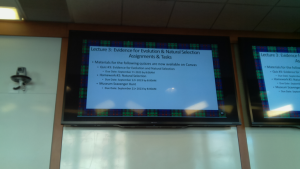
Here are some of the sets of pictures that we took in different lecture rooms across campus. We projected sample slides in HH-1107 and WEH-7500 as you can see below, but we also took images in other rooms. Below, we’ve shown what an image of a slide looks like with our camera, and also that we’ve managed to capture many slides from these angles.


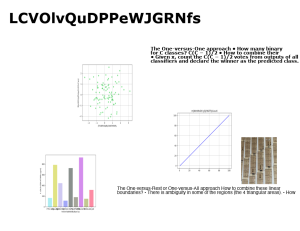
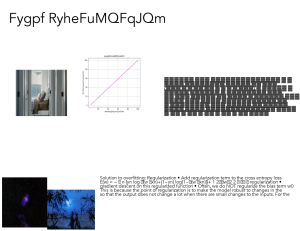
We also fixed a bug (regarding the checkered box pattern instead of text) in the random slide generation, allowing for better quality slides to be produced. Here are some examples – we were able to generate 10,000 slides like this.

Team Status Report for 11.11.23

The most significant risks that could jeopardize the success of the project are primarily related to the ML Model: specifically, not having enough data for the ML model and/or not getting accurate results. We saw poor results this last week when training the graph detection model on a very small number of images, so contingency plans involve having the whole group involved in the data collection process as well as augmenting our data with a large number of auto-generated images, which we have already implemented.

Another risk is not being able to find enough testers/not finding visually-impaired people willing to work with us to test the product. Contingency plans involve testing the product heavily on sighted users, and we are managing the other risk by beginning to reach out to try to find visually-impaired testers.

We did not make any changes to the system design, and did not update our schedule.

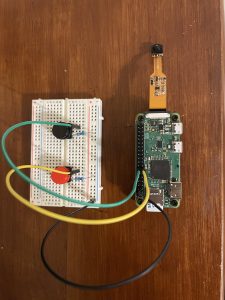
We were able to connect up our Raspberry Pi, camera, and buttons as shown below.

We were able to get the graph generation and slide generation working this week. See Nithya’s post for images of this. We also got the stop button and the app to communicate by setting up a server on the app side.

Team Status Report for 11.04.23

One major risk is that we will not be able to find an appropriate group of testers for our device. If we do not have enough testers, we won’t be able to gather enough quantitative data to indicate whether or not the various aspects of our design worked as intended. In order to tell whether or not we were successful in creating the device we proposed, we need to be able to compare our requirements to enough quantitative results. In order to manage this, we would need to reach out to our contacts and confirm that we can test our product with visually impaired volunteers. If we are unable to do this, we would instead have to settle for testing with volunteers who aren’t visually impaired. Although they would still be able to provide useful feedback, it would not be ideal. Therefore, we should prioritize managing this risk in the coming week.

Another risk is gathering enough data for the graph description model. We found out after looking into our previous Kaggle dataset in more detail that many of the graph and axis titles are in a Slavic language and so will not be helpful for our English graph description model. To manage these risks, we plan to devote the next couple of days to searching for and gathering new graph data; our contingency plan, as mentioned in a previous status report, is to generate our own data, which we will then create reference descriptions for.

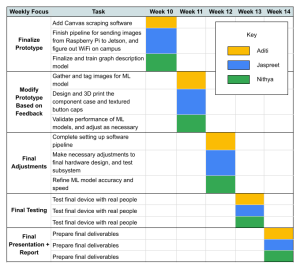
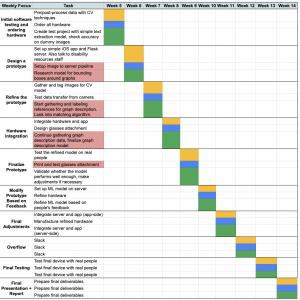
We have adjusted our schedule based on the weeks that we have left in the semester. We plan to finish our device within the next three weeks to leave enough time for testing and preparing our final deliverables.

The following is a test image of a presentation slide displayed on a laptop that was taken from the Raspberry Pi after pressing the “start” button. We can see that the camera brightness may need adjusting, but that it is functional.

For pictures related to progress made on the app this week, see Aditi’s status report.

Team Status Report for 10.28.23

The main risk we saw this week was the weight of the camera attachment being too heavy. We felt like it was much heavier than we expected the attachment to be, but we feel like it still does not pose a major welfare risk to the user as it stands. However, we will need to make additional weight calculations once we attach the component box, and the buttons to the hardware subsystem. If these additional components are too heavy, we will look into getting different buttons, or perhaps even attaching some components outside of the glasses attachment – perhaps use some handheld buttons instead of having them on the glasses. However, the risk is currently being managed by choosing low density materials for the rest of the components, specifically the component box.

A smaller risk continues to be the accuracy of the ML model. We have started looking more into the graph description models, and will change the type of model and the amount of data we train it with in order to mitigate these risks. We have been choosing the specific type of model to manage risks preemptively, because some ML models require much more data than we have the capacity for.

We are currently in the process of implementing our design, and have not made any changes to the design of the system, and no schedule changes have occurred.

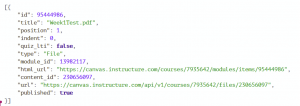
The JSON shows that we have been able to go through the Canvas security handshake and receive a response about the location of the file we are extracting.

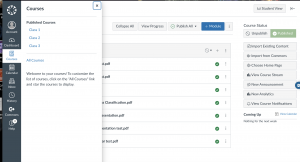
We were also able to create test instructor Canvas courses.

Team Status Report for 10.21.23

One risk that we will have to consider is that our device’s attachment mechanism will not be sufficient or easy enough to use. When looking into how we could create a universal attachment for all types of glasses, we narrowed down our options to using either a hooking mechanism or a magnetic mechanism. With a hooking mechanism, we risk that our users may not be able to easily clasp our device on, and with a magnetic mechanism we risk that our device may not be secure enough. To manage the risk with a hooking mechanism, we can iterate over multiple designs and receive user feedback for which is easiest to use. For the magnetic mechanism, we can try to increase the strength of the magnet so that the attachment is more secure. However, it is worth noting that in the worst case scenario, if neither of these solutions work, the image capturing and audio description functionality of our device will still be testable.

Another risk to consider is the latency of the graph description model; after doing some more research into how exactly the CNN-LSTM model works (see Nithya’s status report), we discovered that the generation of the graph description may take longer than we originally anticipated. Specifically, the sequence processor portion of the model needs to generate the output sequence one word at a time, and the way that a particular word is generated is by performing a softmax over the entire vocabulary and then choosing the highest-probability output. This is discussed more in the “changes” section below, but we can manage this risk by (1) further limiting/decreasing the length of the output description, and (2) modifying our use case and design requirements to accommodate for this change.

The biggest change we made was adding the new functionality of the Canvas scraping software. We figured that it might be unnecessary, annoying, and difficult for the visually-impaired user to have to download the PDF of the lecture from Canvas, email it to themselves to get it on their iPhone, then upload it to the iOS app in order for our ML model to parse it before the lecture. We felt like it also might take too much time and discourage people from using our project, especially if they have lots of back to back classes with short passing periods. So, we decided to add the functionality where the user could simply click a button on the app, and have the Flask server automatically scrape the most recent lecture PDF depending on which button the user clicks. This incurs the following costs:

  1. We need to add an extra week to Aditi’s portion of the schedule to allow her to make the change.
  2. Professors must be willing to provide their visually-impaired students with an API key that they will put into the app so that the application will have access to the lectures in the Canvas course.
  3. The visually-impaired user will have to ask their professor for this API key.

To address cost (1), Aditi is already ahead of schedule, and this added functionality will not put her behind. However, if it does, one of the other team members can help take on some of the load. To mitigate (2), we will provide a disclaimer from the app to explain to the professors that the app will only scrape materials that are already available for the user to see, so there will not be a privacy concern. The app will only scrape the most recent lecture under the “Lectures” module, so unpublished files will not be extracted. We felt like it was not necessary to mitigate (3), because asking for an API key will still likely be faster and less time consuming than having to download and upload the new lecture PDF before every class.

Another change is the graph description model latency which was mentioned above. We will need to change the design requirements to be slightly more relaxed for this specific portion of the before-class latency, which we set at 10 seconds. We still don’t have a specific estimate for how long the CNN-LSTM model will actually take given some input graph, but we may need to increase this time bound; however, this should not be a problem as we have a lot of wiggle room. In our use-case requirements, we stated that the student should upload the slides 10 minutes before class, so the total latency before class need only be under 10 minutes, and we are confident that we will be able to process the slides in less than this amount of time.

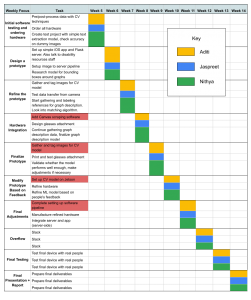
We have adjusted our schedule based on the changes listed above, and have highlighted the schedule changes in red.


Team Status Report for 10.07.23

Our team used several principles of engineering, science, and math to develop the design solution for our project.

  1. Engineering Principle: one engineering principle we considered while developing our design was sustainability. We chose components and emphasized through our use case requirements that the device’s power consumption should not be too high and the app’s power consumption on the user’s phone should also be limited. 
  2. Scientific Principle: one scientific principle we used was peer review – one of the major changes we made to our design was based on the feedback we got from our proposal presentation, regarding having the slides pre-uploaded to the app. Peer review is an extremely important part of the design process since it allows for improvement in iterations. 
  3. Math Principle: one math principle we considered was precision, and this informed our decision for which models to select, as well as the change we made to our original idea of using Tesseract directly during the lecture, to now perform text extraction from the pre-uploaded slides. 

One major risk is the ML model not being finished in time. However, this risk is being managed by simply working on gathering data as soon as possible, which we also mentioned in last week’s status reports. Our contingency plans include using more data that is readily available on the internet, rather than relying on tagging and collecting our own data.

No major changes were made to the design. However, based on the feedback from the design presentation, we plan on thinking more about the design requirements and fleshing these out for the upcoming design report deliverable. We also had questions about why the glasses were necessary, and whether the audio from the device would be too distracting during class. We thought about this feedback, and we decided not to move forward with any changes — we plan on addressing why these concerns were not extremely pressing, and why we think our product will not fall victim to these issues in the actual design report.

See Aditi’s status report for some progress photos on the app simulation!

Team Status Report for 09.30.23

One risk to take into account with the changed system design is the method of matching images taken from the camera with slides from the deck, particularly in edge cases such as animations on the slides where only part of the content is shown when the image is captured, or annotations on the slides (highlight, circles, underlines, drawing, etc.). Our contingency plan to mitigate this risk is having multiple different matching methods ready to try – we have the text extraction method which we will try first, as well as another CNN structure similar to how facial recognition works. In facial recognition, there is a “database” of known faces and an image of a new face that we want to recognize is first put through a CNN to get a face embedding. This embedding can then be compared to those of other people in the database and the most similar one is returned as the best match. 


Another risk/challenge may be generating the graph descriptions so that they are descriptive yet concise; the success of the graph descriptions will depend on the reference descriptions that we provide, so our contingency plan is to each provide a description for each image we use during the training process so that we get less biased results (since each reference description will be weighted equally when calculating loss). 


We made two main modifications to our project this week.

1.  We added a graph description feature on top of our text extraction feature. This was mostly meant to add complexity, as well as help provide users with more information. This requires another separate ML model that we have to collect data for, train, and implement. This incurs the cost of increasing the amount of time it will take for us to collect data, since we were only previously expecting to collect data for slide recognition. However, we plan on mitigating these costs by finding a large chunk of the data online, as well as starting to create our own data as soon as possible, so we can get started early. This also feeds into our next modification, which is meant to help ease the burden of manufacturing our own data.

2.  We modified our product to include a feature where the user should upload the slides to the app which their professor has made available before the lecture. Then, when the user takes a picture with our camera during class, our app will just compare the text on the picture the user has taken with the text on the pre-uploaded slides, and recognize which slide the professor is currently on. This is important because our product will extract both text and graph data with much better accuracy since we would be working directly off of the original formatted slides, rather than a potentially blurry and skewed image that the user would take with our fairly low resolution camera. This also decreases the latency, because now all of the text and graph descriptions can be extracted before the lecture even begins, so the only latency during the lecture will be related to determining which slide the user is on, and the text to speech — both of which should be fairly quick operations. This modification also allows us to scrape lots of the training data for our ML model from online: previously we would have to collect data of blurry or angled photographs of slides, but now that we’re working directly off of the original slides and graphs, we would only need pictures of the slides and graphs themselves, which should be easy to find ourselves (and create if needed). This does incur the extra cost of the user having to upload the slides beforehand, which raises accessibility concerns. However, we plan on including haptics and accessibility functions to the app that would make this very easy. It also incurs the cost of the professor having to upload the slides beforehand, but this is usually done regardless of our product’s existence, so we don’t think this is too big of a concern.


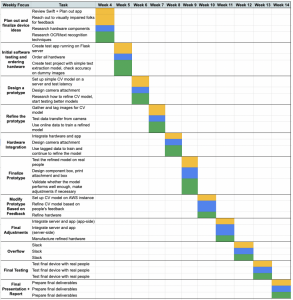
Here is our updated schedule, which is also included in the Design Presentation:


Here are some progress photos from this week:

Slide bounding box recognition:

Slide pre-processing:

ML Data Tagging Tool:

Team Status Report for 09.23.23

We have identified a few risks that could jeopardize the success of the project. Some of these challenges include optimizing the speed of data transfer and ML model (because we need the user to receive feedback in real-time), dealing with transcribing/reading math symbols and equations, performing extraction on poor-quality images, and making sure that the power consumption of both the device and the phone are appropriate for the device to be useful to user throughout the school day.

We have come up with some risk management plans, which include potentially switching to a smaller-size NN to reduce latency, including a wide variety of training images (which have mathematical symbols, low-contrast, blurry, etc.), making sure we have a high-quality camera to capture images, and switching out components for more power-friendly alternatives if needed.

The major change we made was narrowing the scope of the project to only perform text extraction and reading on presentations in classroom settings. This change was necessary since gathering enough training data for the system to perform recognition on any setting would have been difficult, and we wanted to prioritize the accuracy of our system. The change did not incur any costs in particular, but if time allows, we may expand our system to perform scene description on images included in a presentation.

Here is our most recent schedule:

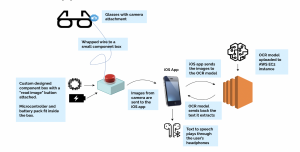
Here is our most recent block diagram:


For our project, we had to consider multiple ethical concerns in order to make sure the product was as accessible to the public as possible. One specific concern we addressed was welfare: we wanted our product to be comfortable for the user, and we didn’t want it to detract from their overall learning experience, so we are planning to develop our device to be as lightweight and convenient as possible. Welfare concerns are extremely important to consider whenever developing a product, because we want to make sure that the user is as comfortable as possible, and we must make sure that it is accessible to everyone: a product might be convenient for some people, while not so much for others. Both of these kinds of people are valid users, and a product should be developed with both kinds in mind so that as many people as possible can benefit from the device.