One major risk is that we will not be able to find an appropriate group of testers for our device. If we do not have enough testers, we won’t be able to gather enough quantitative data to indicate whether or not the various aspects of our design worked as intended. In order to tell whether or not we were successful in creating the device we proposed, we need to be able to compare our requirements to enough quantitative results. In order to manage this, we would need to reach out to our contacts and confirm that we can test our product with visually impaired volunteers. If we are unable to do this, we would instead have to settle for testing with volunteers who aren’t visually impaired. Although they would still be able to provide useful feedback, it would not be ideal. Therefore, we should prioritize managing this risk in the coming week.
Another risk is gathering enough data for the graph description model. We found out after looking into our previous Kaggle dataset in more detail that many of the graph and axis titles are in a Slavic language and so will not be helpful for our English graph description model. To manage these risks, we plan to devote the next couple of days to searching for and gathering new graph data; our contingency plan, as mentioned in a previous status report, is to generate our own data, which we will then create reference descriptions for.
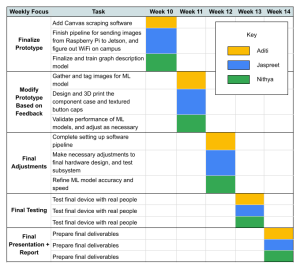
We have adjusted our schedule based on the weeks that we have left in the semester. We plan to finish our device within the next three weeks to leave enough time for testing and preparing our final deliverables.

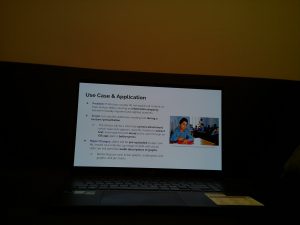
The following is a test image of a presentation slide displayed on a laptop that was taken from the Raspberry Pi after pressing the “start” button. We can see that the camera brightness may need adjusting, but that it is functional.

For pictures related to progress made on the app this week, see Aditi’s status report.
