
18-796 Multimedia Communicaions:
Coding, Systems and Networking
Midterm Project Report
Group members: Ching-Kai Huang Wing Ho Leung
Implementation of a speech codec based on coding of speech at 8 kbit/s
using conjugate-structure algebraic-code-excited linear-prediction (CS-ACELP)
[ITU-T Recommendation G.729A]
Our goals for the midterm project is to implement the preprocessing and LP analysis modules of the encoder, the reconstruction of the LP synthesis filter, and high-pass filtering and upscaling at the decoder.
We took .wav files that is sampled at 8000 Hz using 16-bit linear PCM. The encoding process is done every 10ms frame or 80 samples. First the samples are high passed with cut-off frequency of 140 Hz and scaled down by 2. A total of 240 samples are buffer for windowing and autocorrelation computation. The autocorrelation coefficients are used to calculate the LP filter coefficients using the Levinson-Durbin algorithm. The LP filter coefficients are converted to Line Spectral Pair (LSP) coefficients for quantization and interpolation purposes. Since the quantization process requires some vector quantizer codebooks, which is not provided and have not been identified, the quantization process has not been implemented. LSP coefficients are converted back to the LP filter coefficients, which is just the reverse process of the conversion from LP to LSP. This module is exactly what the decoder will need in order to convert the LSP coefficients to LP coefficients.
The encoder reads in the wave file frame by frame, and outputs the high-passed signal to the decoder frame by frame. It also outputs the LP, Line Spectral Frequency(LSF), autocorrelation coefficients, interpolated LP and interpolated LSF coefficients for each frames to another file. The decoder reads in the first output file from the encoder and high-pass filter and scaled it and output it to a wave file.
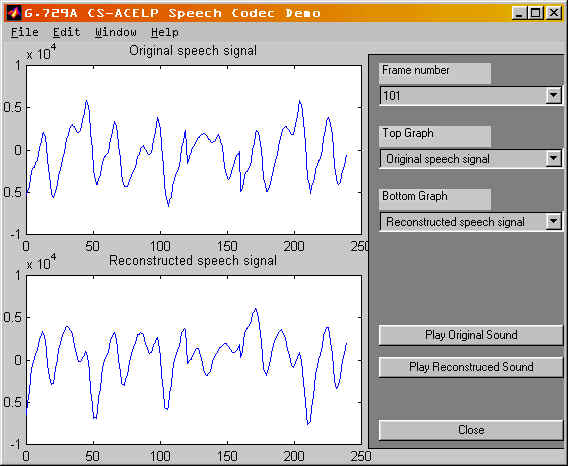
We have implemented a MATLAB graphical user interface. This user interface is capable of displaying different signals of different frames. These signals include the original speech signal, the preprocessed signals before and after low-pass filtering, the autocorrelation functions before and after bandwidth expansion, the LP synthesis filters before and after interpolation, LSF before and after interpolations and the reconstructed speech signal. Two different graphs can be viewed at a time in order to facilitate comparison. In addition, we can listen to the original and reconstructed .wav files using our MATLAB user interface in order to evaluate the quality of the reconstructed speech. The following figure shows a snapshot of our MATLAB graphical user interface: