Maya’s Progress Report 2025-04-26

Progress This Week:

  1. Final Model House Assembly:
  2. System-Wide Integration:
    • Worked on integrating all electronics subsystems into a cohesive unit.
    • Ensured communication and coordination between various components including power sensors, motors, fans, lights, and the backend.
  3. Collaborative Integration with Team Members:
    • Final integration of backend systems and automation logic with Anya’s code.
    • Connected Erika’s model and planning elements with the functioning electronics to align the system behavior with the physical house layout.

Challenges Encountered:

  • Aligning hardware layout with model structure required careful adjustments to cabling and sensor placement.
  • Synchronizing logic between Anya’s automation code and the backend required debugging API endpoints.

Next Steps:

  • Finalize physical assembly and test all integrated electronics.
  • Run full-system tests for behavior validation and robustness.

Anya’s Status Report 04/26

  • Things done:
  • Changed the ML model flow as follows
  • Training → Save as .pkl → Backend loads .pkl → Predict → Dashboard displays
  • Trained the models offline to predict solar generation and grid prices, then saved the trained models as .pkl files. This separated the training phase from the backend operations. In the backend server, implemented code to load the .pkl files at startup.

    Predictions are passed to the frontend dashboard through FastAPI routes, where they are visualized alongside real-time sensor data. This setup made the dashboard faster and more reliable, since model loading happens once at server start instead of during each user request.

    This method avoids long inference delays and made it easier to update models by replacing the .pkl files when retraining was needed.

    Did some user testing to see whether people would actually use the product

User Satisfaction Metrics
  • UI Navigation:
    Measures how easily users were able to navigate and interact with the SmartWatt dashboard during their first use.

  • Feature Usability:
    How intuitive and useful users found key SmartWatt features
    (Average score: 8.0/10)

  • Schedule Understanding:
    Evaluate whether users understood the optimized appliance schedules generated by the backend system.

Progress

Almost done, now need to just prep setup for the demo

Things to Complete Next Week

  • Video
  • Work with Erika and Maya to finish getting everything working together in the model house
  • Poster
  • Demo
  • Final Report

Team’s Status Report 04/26


Risks

During demo testing, router issues on Maya’s laptop temporarily disrupted Raspberry Pi connectivity. We are switching to a new device router for stability. This can be a network setup challenge since we havent fully tested communication over this new network.

Changes

We changed the setup to use a standalone router for the Pi. the Pi connects to Wi-Fi network using the router.

Progress

  • Unit Testing 

    • Tested device control APIs

    • Evaluated forecasting model accuracy (MAPE/RMSE) on solar and price data.

    • User Testing & User satisfaction
  • Frontend-Backend Integration Progress:

    • Connected backend schedule outputs to frontend dashboard for live visualization.


Unit Tests Conducted

  • Device Control Test: Verified API calls successfully switched smart devices ON/OFF at the correct time by looking at system logs
  • Optimization Solver Test: Validated LP outputs feasible schedules under varying constraints, edge cases include flat/spiky data for prices and solar output
  •  Forecasting Model Test: Evaluated regression predictions against known solar generation and pricing data.
  • UI Functionality Test: Confirmed correct display of real-time power data, scheduled actions, and user overrides.
  • Front-End API Connectivity Test: Confirmed that React frontend could successfully call FastAPI endpoints and receive responses.


Overall System Tests:

  • End-to-End Scheduling Test: Simulated a full daily cycle from sensing → predicting → optimizing → scheduling → controlling devices.

  • Stress Testing: Input flat load profiles and sudden random spikes to test optimization stability and system robustness.

  • Latency and Responsiveness Test: Measured UI response time under background optimization tasks.

  • End-to-End API Test (Chatbot): Tested communication between chatbot UI and backend, ensuring user input is captured and responses are sent back

Findings and Design Changes

  • Edge Case Handling: Stress testing exposed situations when no feasible schedule existed (overlapping tight constraints); we added fallback rules.

  • API Logging Addition: Initial debugging was slow without detailed API logs. We added full request/response logging to trace failures and latency bottlenecks.

  • Shift to Asynchronous Processing: Originally, synchronous optimization caused UI freezes. Moving to background task execution using FastAPI improved responsiveness.

  • Prediction Model Tuning: Retrained regressions models with better feature scaling and added time-of-day features to improve accuracy in volatile solar conditions.

Erika’s Status Report for 04/19/2025

What I accomplished this week:

This week, I made significant progress on both the physical and software components of the project, dedicating a lot of time to work on the design, fabrication, coding, and electronic components of SmartWatt.

  • Mechanical Design & Fabrication:
    I completed a full redesign of the house structure in CAD to incorporate finger joints, which greatly improved the stability and robustness of the model. This change ensures the structure is more durable and can handle repeated assembly and disassembly without loosening or falling apart.
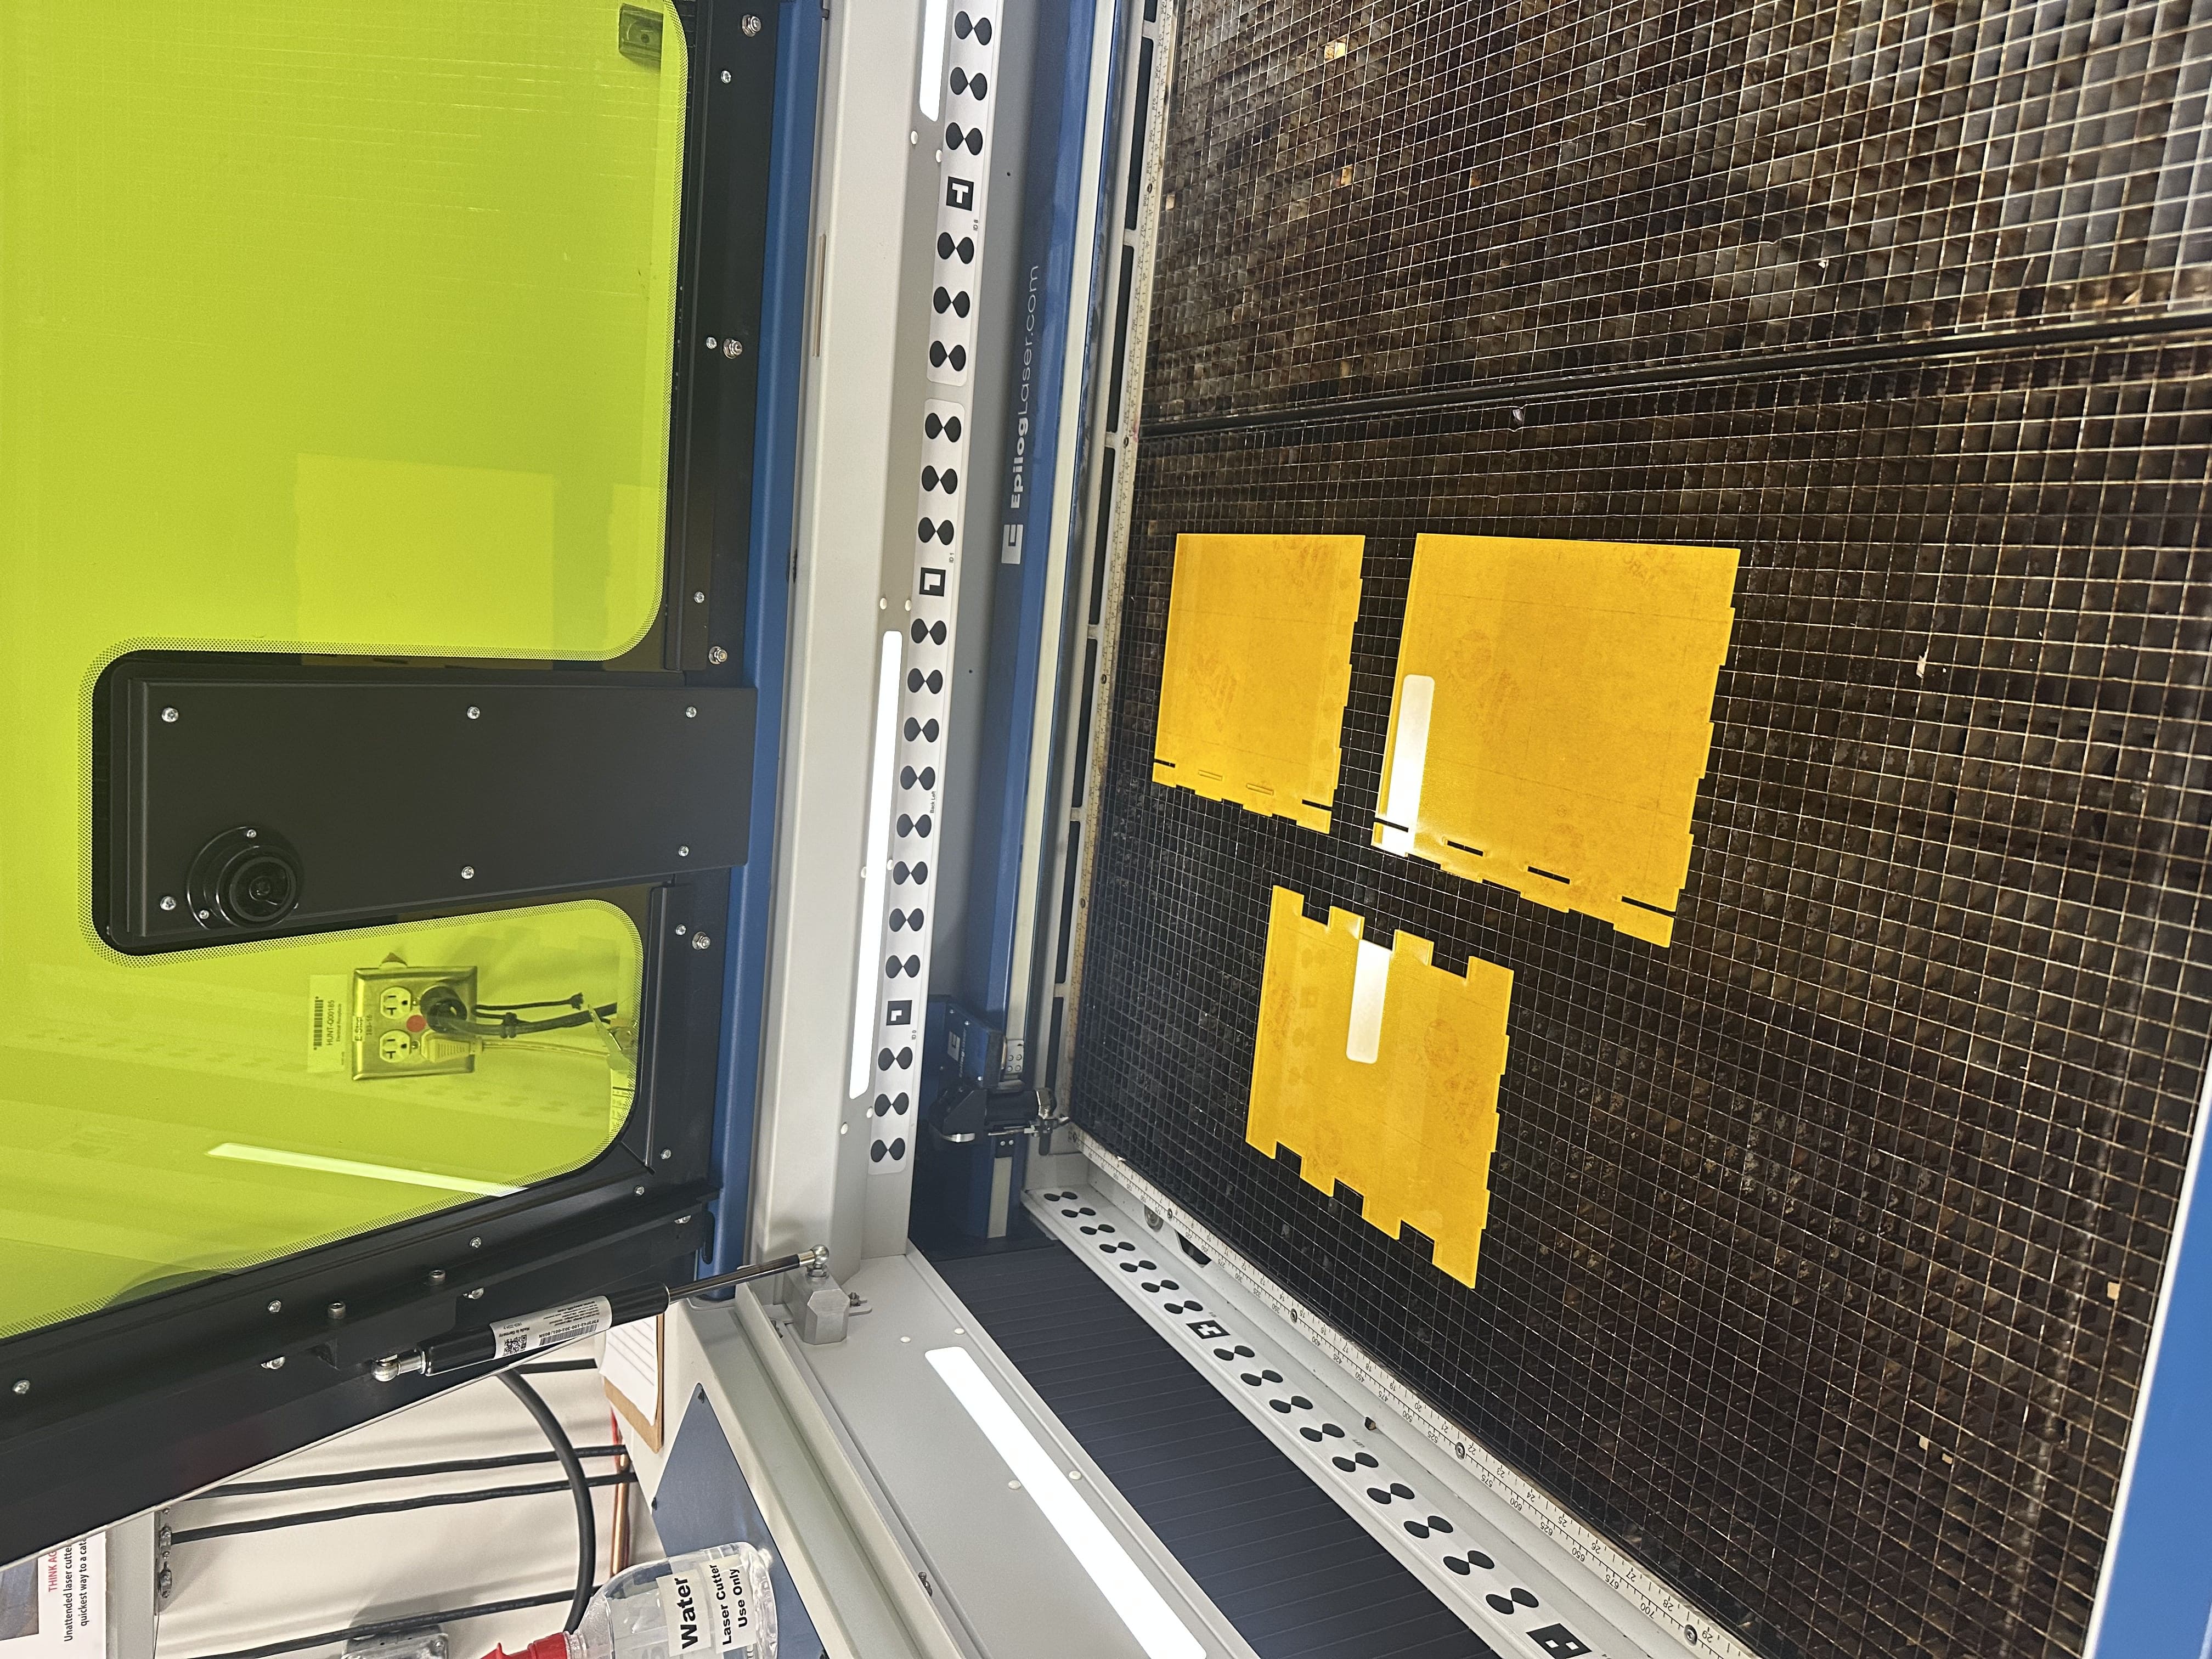
    After finalizing the design, I finished laser-cutting all of the components for the house using both wood and acrylic materials. This marks a major milestone in the physical build of the prototype.

  • Software & Electronics Development:
    I coded the chatbot system that will serve as one of the primary interfaces for user interaction. After evaluating different models, I decided to use an OpenAI LLM to power the chatbot due to its flexibility, customization potential, and strong performance in conversational tasks.
    On the hardware side, I successfully set up and programmed an LED ring to visualize the passage of time, where one minute equals one simulated day. This ring offers an intuitive way to represent time-based changes in the home’s energy behavior.

.

Unfortunately, I am not able to upload a video demo because of the file size limits.

Project schedule status:

My progress is currently on schedule. With major fabrication and basic chatbot functionality complete, we are ready to move into final integration in the final week.

Goals for next week:

  • Feed custom user data into the OpenAI LLM so the chatbot can give energy-saving recommendations tailored to a specific user’s home and help the user make sense of their dashboard

  • Begin integration between the TypeScript frontend and the Python backend, ensuring smooth communication between the user interface and the underlying AI and hardware logic.


New tools and knowledge acquired:

  • I learned how to use CAD to design a house, including how to sketch, add dimensions, and combine parts into a full assembly using mates. To do this, I watched a series of Fusion 360 YouTube tutorials and experimented by prototyping small sections before scaling up to the full house model.

  • I also learned how to laser cut. I went to Ideate’s makerspace in Hunt Library and was taught by a friendly laser cutting attendant who walked me through the steps of setting up the machine and preparing my design for the cut.
  • For the chatbot, I familiarized myself with the OpenAI API, especially prompt engineering and how to structure memory inputs. I referenced the OpenAI documentation and read through a couple of online tutorials.
  • Setting up the LED ring involved learning to use the Adafruit NeoPixel library and integrating it with my microcontroller. I followed online forum posts and GitHub examples to adapt existing code for my project’s timing logic.

These informal learning strategies—particularly hands-on experimentation and community support—were essential in rapidly acquiring the skills needed.

Team’s Status Report for 04/19

Risks

  • Model Deployment Latency: ML model loading during user requests (e.g., price forecasting) caused site latency and crashes.  The models were being loaded inside the FastAPI route handlers at runtime during each user request. Every time a user accessed the forecast route, the model had to be deserialized from disk which introduced delays Will move the model loading logic to the top-level script (the FastAPI startup event or global cache)
  • Ensuring all the wiring and hardware components have enough physical space in the demo house to be properly integrated and mounted.

Changes

ML workflow is being restructured:

  1. Preload models at startup using global caching to ensure they are loaded once and reused.

  2. Introduce a prediction cache, where forecast results are computed periodically (e.g., every 30 minutes) and stored in memory or a lightweight JSON/SQLite file.

Progress

  • Device actuation and control complete
  • Device scheduling complete
  • Testing and Verification of Optimization subsystem complete
  • Routing for backend : Separated all core functionalities into clean routes (/, /optimize, /analysis, /history, etc.) with a responsive dashboard UI.
  • Working on integrating the python backend with typescript front-end.

Anya’s Status Report for 04/19

Work Accomplished

Integrated the devices (Big LED, PWM Fans) to the dashboard.

  • Implemented real-time device control through the dashboard with “Turn On/Off” capability.

  • Optimized the calls for device state and history queries to stay under 500ms latency.
  • Added schedule-based control logic using persistent JSON storage and periodic polling, enabling automated device operation aligned with user preferences.

  • Tested the optimization algorithm. Measured the latency, with the full scheduling computation consistently completing within 500ms to 1.5s. This ensures that users receive near-instant recommendations
  • Evaluated how well the algorithm responds to price shifts by injecting synthetic price spikes in the mid-afternoon. The optimizer avoided those periods unless solar generation was high, confirming that the algorithm appropriately weights cost considerations. In solar alignment tests, we simulated peak solar output at 11 AM–2 PM and observed the optimizer shifting device usage accordingly, validating the integration of renewable energy forecasts into the objective function.
  • Verified solver stability and objective sensitivity to weights which include grid price and solar output.

Progress

  • The Software – Embedded Layer actuation is done.
  • I faced issues with ML model integration—currently, the models for forecasting grid prices and solar output are being called during route execution, which causes high latency and even site crashes (too long to respond) in some cases. I still need to figure out how to load the trained models separately and keep them persistently available to the app (running inference in a background job queue) rather than reloading them with each request. I am slightly behind schedule on that integration.

Next Steps

  • Add More Devices to Dashboard:

    • Extend the devices list to include the other speaker and motors. On the dashboard will create a filter to view  power sensor mapping for each new device for usage tracking and optimization.

Refactor current ML routes to load models once during app startup instead of per-request.Use a tool to preload models and serve fast predictions.

Knowledge and Tools

  • FastAPI & Jinja2 Templating: I had to learn FastAPI for building a responsive backend, and how to integrate it with Jinja2 for rendering dynamic HTML dashboards.

  • Home Assistant API Integration: I learned how to query real-time sensor states, parse device schedules, and handle authentication with Home Assistant’s REST API.

  • Linear Programming with PuLP: I explored energy cost minimization and scheduling using linear programming, learning how to define decision variables, objective functions, and constraints.

  • Data Visualization (Chart.js, ECharts): I gained familiarity with frontend charting libraries to visually present sensor data, solar forecasts, and results in user friendly way.

  • Model Deployment (joblib, XGBoost, Scikit-learn): I had to train and serialize ML models for solar and pricing forecasts, then load them into the backend

Erika’s Status Report for 04/12/2025

Progress this Week:
This week, I redesigned the model house structure to incorporate finger joints. After observing structural weaknesses during our interim demo, I realized that the original flat-edge design was not sturdy enough, especially when using acrylic sheets for the inner walls that lacked sufficient support. I also met with my team to finalize where we want to include the electronic components so I can include holes for those wire feedthroughs. To address this, I modified the CAD models for all the walls to include finger joints and feedthrough holes for better structural integrity and easy integration. I then regenerated the corresponding DXF files for laser cutting.

Following these updates, I re-laser cut most of the acrylic and wood sheets. This process included completing the full assembly in CAD to ensure the finger joints fit together cleanly.

Challenges
My progress is currently on schedule. While redesigning the house model and re-cutting parts was not initially planned, this adjustment was necessary for the long-term stability and success of our prototype. I have built in buffer time for tasks like this, so I’m confident we are still aligned with our project timeline.

We also placed a lot of orders this past Wednesday, so I hope those arrive early next week so we can continue wrapping up the final pieces of our project.

Next Steps:

  • Finish laser cutting the remaining few acrylic sheets

  • Assemble the redesigned model house

  • Begin integrating the LLM chatbot using the Ollama setup that Maya worked on

  • Set up wiring and begin coding the LED ring to simulate the passage of time in our simulated reality environment (where 1 simulated day = 5 minutes in real time)

Team’s Status Report for 04/12

Risks

  • We are training LSTM/CNN models based off of data polled from sensors.  Retraining the model every request (if the cache fails) can cause lag

  • Home Assistant API latency spikes can delay forecasts. Plotting charts via matplotlib adds overhead (200–300ms)

  • Caching logic failing silently if timestamps are misaligned
  • Infeasible LP results due to overlapping constraints or underforecasted solar

  • LP objective may optimize cost but ignore user experience (e.g., clustering devices)

  • Forecast errors can propagate into LP, yielding poor schedules

Changes

The initial approach used an LSTM network to forecast solar generation based on time-series data from sensor.maya_solar_panel. Main challenge was high latency due to recurrent nature and sequential computation and overfitting on short term trends rather than daily cycles. Transitioned to a 1D Convolutional NN. CNNs capture short-term temporal correlations ( sunrise to peak curve) better.

Progress

  • Successfully polled data from all sensors into backend
  • CNN model produces realistic solar forecasts aligned with production hours

  • Performed testing on API response times

Verification/Validation

  • Used curl requests to profile API timing in the terminal while polling data from sensors

  • Unit tested LP constraints to ensure feasibility and logic correctness
  • Compared cached vs. uncached outputs for CNN model for correctness and stability

  • Compared forecast vs. actual solar power to assess prediction alignment
  • To validate the 15% energy savings, we’ll compare historical baseline energy usage (from fixed schedules) against SmartWatt’s optimized schedules using the same input conditions. Using sensor data (from sensor.maya_fan_power, sensor.maya_solar_panel), we’ll simulate both scenarios over a 1–2 week period and calculate daily energy costs. The optimized case will use CNN-based solar forecasts and LP scheduling. If the average cost reduction exceeds 15% compared to the baseline, the savings target is met.
  • To verify the robust assembly of the house, I will carry the house around and apply reasonable force to ensure it will remain intact during the demo.
  • To validate the integration of the hardware components with the house, I will perform a fit test with the interior components. I will ensure that all feedthrough holes are wide enough and that the components can be neatly and securely placed inside their respective rooms.
  • For validation, we plan to conduct user testing sessions where participants interact with the model house and dashboard to simulate their household energy consumption. This will help us evaluate whether SmartWatt creates a coherent and immersive experience. We will analyze user feedback to determine if the system effectively communicates the intended purpose of the project, the scaled energy usage and passage of time, and feels intuitive to interact with.


Anya’s Status Report for 04/12

Accomplishments

  • Integrated real-time sensor polling and displayed it on the dashboard

  •  Developed a responsive FastAPI + HTMX dashboard to display live sensor values

  • Implemented Chart.js charts that auto-refresh every few seconds without full page reloads

  •  Latency about 10s for the API calls, page refreshes every 30s

Progress

Reduced latency by introducing in-memory caching for the a CNN solar forecast endpoint

  •  Forecast results are now cached and refreshed every 10 minutes, eliminating redundant model retraining on every request

  • Slightly behind progress, need to integrate all the charts in the same app with routing
  • Verification

Performed basic verification of the CNN forecasting model to ensure it meets the intended design requirements for solar prediction accuracy.

  • Input Feature Sanity Checks:
    Verified that time-series input includes correct power, sin_hour, and cos_hour features, resampled to 15-minute intervals.
    Resampling was validated via debug logging (len(df), delta distributions).

  • Window + Horizon Coverage:
    Model was trained on sliding windows (e.g., 48 steps = 12 hours) with a 24-step forecast horizon. These parameters were confirmed to provide full diurnal coverage and enough context for trend learning.

  • Envelope Alignment Verification:
    The daylight envelope was implemented and centered around peak solar generation (13:00–14:00) to prevent unrealistic output at midnight. Forecasts before and after masking were compared to confirm correction.

  • Polling Interval Consistency:
    The system pulls data using HA/api/history/period endpoint. I confirmed that sensors such as sensor.maya_solar_panel, sensor.maya_fan_power, sensor.maya_fan_voltage, and sensor.maya_fan_current are polled with sufficient granularity — typically every 5–10 minutes.

  • Each response is parsed to validate:

    • state is numeric and finite

    • last_changed timestamps are increasing and consistent

    • There are no large gaps in time , > 1 hour)

  • Resampling Debug Logs:
    Added internal logging to capture the number of raw and resampled datapoints. This ensures the model always receives enough sequential history for the sliding window.
    Used interpolation (.interpolate()) on the resampled time-series to ensure continuity in data, even if occasional values are missing from Home Assistant.

  • latency tests via time curl http://localhost:5051/api/endpoint to make sure the dashboard refresh updates meet design and usecase requirements

Next Steps

  • Test LP behavior under forecast uncertainty

    • Run LP with low vs. high solar predictions

    • Assess how schedules shift and whether they violate any constraints

  • Stress-test LP under edge-case constraints

    • Zero solar availability

    • Multiple high-power devices requiring overlap

    • Very short vs. very long runtime constraints

Test LP reactivity to live data

  • Feed in updated solar forecast every hour

  • Ensure LP returns updated schedules quickly (<2 sec)