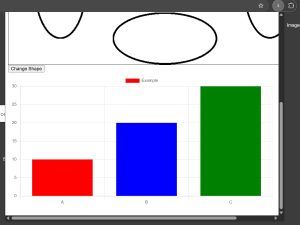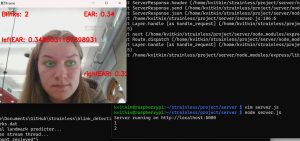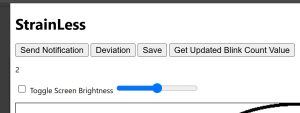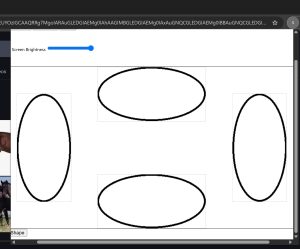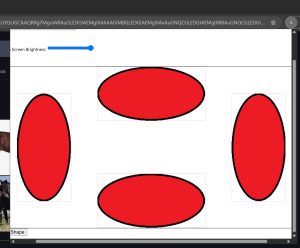
This week I gave the final presentation, so preparing this presentation took up a lot of my time this week. Additionally, I worked on the graph display for the neck angle data, which we were able to get working. Next week, I would like to test receiving inputs for both the blink rate and the neck angle at the same time and make sure these graphs can both update correctly at the same time since although we have tested them separately we haven’t yet tested them together. I want to get this done before the final video on Wednesday and final demo on Thursday so that I can demonstrate this functionality then.
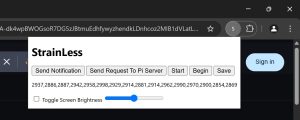
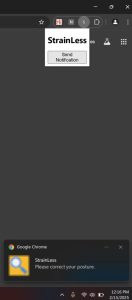
I am on schedule this week. Next week I hope to test the browser extension to see how it does with multiple inputs and make sure it still works properly as well as make the browser extension a little more pretty probably with adding CSS to the HTML for the popup.