This week, we finished implementing the mister actuator, the heater actuator, and the LED matrix display. We also tested the late fusion machine learning model for plant health classification, fixed several WebApp bugs, and added new functionality to improve usability. Integration between the WebApp, the actuators, and the control system is progressing smoothly, and the automatic control logic has been successfully tested under manual and automatic modes.
Progress:
- Mister actuator implemented and functional
- Heater actuator implemented and functional
- LED matrix displays actuator statuses and plant health classification
- Late fusion ML model tested successfully
- WebApp bugs fixed and new features added
- Sensors and actuators integrated with WebApp
- Automatic and manual control tested
- System operating in current greenhouse setup
Significant Risks: The most significant risk at this point is transporting the greenhouse from our current room in HH to the demo room in UC. There is a chance that something could get displaced or broken during the move, and it would be difficult to quickly fix major issues because we only have about 30 minutes to set up. To mitigate this, we plan to arrive early on the day of the demo to carefully move the greenhouse, perform a full functionality test, and ensure everything is working before entering the demo area. We will bring backup materials, tools, and spare sensors just in case.
Design Changes: No major changes were made to the overall system design, requirements, or block diagram this week. The system has now fully met the original specifications, and all actuators and sensors are operational. Any small adjustments were purely for bug fixes and user interface improvements on the WebApp. These had minimal cost impacts and were necessary for improving the reliability and user experience of the system.
Next Steps:
- Finish testing stabilization times of the greenhouse system
- Fix a few minor WebApp bugs
- Finalize WebApp user interface
- Complete the final poster, demonstration video, and written report
- Prepare and practice for the final demo presentation
Testing:
The following are the tests we carried out over the system:
Unit Tests:
- Sensor Accuracy tests (Zara)
- We compared the temperature and humidity sensors to calibrated measuring equipment and found that the sensors were within 1.51%
- For the other sensors we could not afford calibrated equipment within our budget for testing, so we opted to test relative changes of collected data in response to changes in the system by actuators. We found that light, and soil sensors responded appropriately to changes in the environment, (e.g. for each step of light intensity there was a change of at least 200 lux consistently, soil moisture responded differently for each plant, but consistently deceased when not watered for days, and increased after regular watering)
- Sensor Latency (Zara)
- We sent data from our hardware to webapp and compared timestamps to find the latency
- We found that sensors connected directly to the raspberry pi had a 0.5s latency from sensor to webapp
- Sensors connected to the arduino had a 2.8s latency as information travelled from sensor to arduino to raspberry pi to the webapp
- Actuator Accuracy (Zara)
- We compared set values to actual values reached after stabilization
- We found that for all cases in light intensity, increasing heat, increasing humidity we are able to reach target values 100%. But if the greenhouse required a cooler temperature plant than room temperature, as we do not have a cooling system we could not cool to reach the target temperature. As we do not have the time to implement a new system for this we aim for cooling naturally through the mister.
- Actuator Stabilization time (Zara)
- We plan to measure the time between the set time and the time it takes for the system to stabilize
- This is still in testing as we are collecting data to measure this time
- Webapp User Experience (Yuna)
- We plan to have users rate 1-5 on ease of use, design, functionality, performance
- This is yet to be tested
- Live Streaming Latency (Jana):
- We tested the live streaming latency by comparing the timestamp of when a frame was captured by the RPi camera to the timestamp of when it was displayed on the WebApp. We tested this for about 1670 frames, and found that the average latency is 1.95 seconds, which is below our requirement of latency < 2 seconds.
- Plant Identification API (Jana)
- We tested the Plant Identification API on our dataset of 746 images of plants (applying random transformations such as rotation, noise, blur, etc), and it correctly identified each of the 4 species every single time (TPR of 100%, Recall of 100%).
- ML Plant Health Model (Jana)
I tested the ML Plant Health model in 4 stages:
Stage 1: Image model (online data)
I tested the 3 models (ResNet18, ResNet50, and MobileNetV2) on 2 different online datasets (PlantDoc, and an open source houseplant dataset on roboflow).
I got the following results:
Houseplant dataset:
ResNet18:
- True Positive Rate (TPR): 0.8302
- True Negative Rate (TNR): 0.9491
- False Positive Rate (FPR): 0.0509
- False Negative Rate (FNR): 0.1698
ResNet50:
- True Positive Rate (TPR): 0.8302
- True Negative Rate (TNR): 0.8889
- False Positive Rate (FPR): 0.1111
- False Negative Rate (FNR): 0.1698
MobileNetV2:
- True Positive Rate (TPR): 0.8774
- True Negative Rate (TNR): 0.9537
- False Positive Rate (FPR): 0.0463
- False Negative Rate (FNR): 0.1226
PlantDoc dataset:
ResNet18:
- True Positive Rate (TPR): 0.9653
- True Negative Rate (TNR): 0.9176
- False Positive Rate (FPR): 0.0824
- False Negative Rate (FNR): 0.0347
ResNet50:
- True Positive Rate (TPR): 0.9422
- True Negative Rate (TNR): 0.8824
- False Positive Rate (FPR): 0.1176
- False Negative Rate (FNR): 0.0578
MobileNetV2:
- True Positive Rate (TPR): 0.9538
- True Negative Rate (TNR): 0.8941
- False Positive Rate (FPR): 0.1059
- False Negative Rate (FNR): 0.0462
Based on these results, I chose the ResNet18 model trained with the PlantDoc dataset.
Stage 2: Sensor Model (online data)
I trained a simple MLP classifier on online plant sensor data, and achieved the following results:
- True Positive Rate (TPR): 0.9778
- True Negative Rate (TNR): 0.9333
- False Positive Rate (FPR): 0.0667
- False Negative Rate (FNR): 0.0222
Stage 3: Late Fusion Model (our collected dataset)
Our dataset consists of 746 images and sensor data points of 14 different plants across 4 plant species. I fine-tuned the image and sensor models with our dataset, and trained a classifier using the concatenated sensor and image features from the pretrained image and sensor models. This achieved the following results:
- True Positive Rate (TPR): 0.9091
- True Negative Rate (TNR): 0.9496
- False Positive Rate (FPR): 0.0504
- False Negative Rate (FNR): 0.0909
Stage 4: Multi-Class Classification (online data):
We initially planned on developing a model that can predict specific plant health labels such as ‘overwatered’ or ‘underwatered’. Despite the limitations in available datasets, I decided to train a multi-class model using one of the more suitable datasets (houseplant dataset on roboflow) to see if further classification into more specific categories could be possible. The results show significant variation in performance across different categories, which is why I decided against using it in our project:
TPR FPR FNR TNR
healthy 0.986111 0.207547 0.013889 0.792453
bacterial spot 0.888889 0.000000 0.111111 1.000000
dehydration 0.687500 0.003268 0.312500 0.996732
mineral deficiency 0.666667 0.003165 0.333333 0.996835
sunburn 0.680000 0.010101 0.320000 0.989899
late blight 0.571429 0.000000 0.428571 1.000000
leaf curl 1.000000 0.000000 0.000000 1.000000
overwatering 0.571429 0.003175 0.428571 0.996825
rust 0.562500 0.009804 0.437500 0.990196
powdery mildew 1.000000 0.003175 0.000000 0.996825
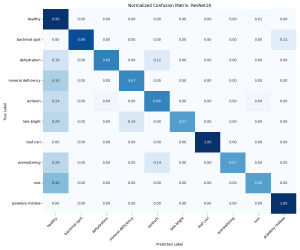
So overall, our ML plant health classification model has a FPR of 5.04%, and a FNR of 9.09%. We had initially stated that we wanted a FPR of less than 10% (which was achieved), and a FNR of less than 5% (which was not achieved). Given that these were the best results achieved, I will have to update the design requirements to reflect that. Our new targets are a FPR <10% and a FNR <10%.
Overall Tests:
- For overall systems testing we manually performed end to end testing the following systems
- Plant Identification through webapp (Jana and Yuna)
- Fully testing the process of inserting a plant and having it display on the webapp for the user if they do not know the plant
- Initial tests found this working successfully with the API, however, sometimes delays in MQTT protocol cause the API to timeout, to fix this we increased the timeout for the call and ensured faster MQTT times buy not overloading the RPI’s memory and implementing threading for MQTT calls
- Plant Health Classification through webapp (Jana and Yuna)
- Fully testing the user being able to get a recent health status of the plant through the webapp
- A successful classification is visible on the webapp of the plant’s health through a capture of the plant’s image and classification within ~5s
- Manual actuator control through webapp (Yuna, Jana, and Zara)
- Testing turning on and off all the actuators through the webapp
- All work with a latency of <0.5s
- Automatic actuator control through webapp (Yuna and Zara)
- Testing switching to automatic control of the system and whether it controls
- Successfully works and the user is able to changes the automatic schedule
- Sensor data collecting through webapp (Yuna and Zara)
- Test to see whether sensor data successfully appears on the webapp for the past 24 hours
- Successfully viewed on the webapp with graphs displaying all data
- Plant Identification through webapp (Jana and Yuna)