Arnav’s Status Report for 4/27

This week I spent time preparing for the final presentation, improving the Session History Page, and additional testing for the whole system. For the final presentation, I made sure that we had the Session History Page integrated with the camera so that we could include this in the current solution slide for the presentation. I also made sure to do some additional research and read extra documentation so that I knew all the details regarding the project and could present all of the work we have done this semester. For the Session History Page, I made it so the date of the session is now on the x-axis (rather than the session id) and the user can easily see how they are improving over time. Below is a screenshot of how the page looks:

I am on schedule and am looking forward to the final demo this Friday. I am now working with Rohan and Karen to make sure all the components of the project are fully integrated for the demo and that all parts of the UI are working as expected. I am also working on our respective parts of the final poster, final video, and final report. This project has been a great learning experience and I am excited to show everyone our final product!

Arnav’s Status Report for 4/20

This week and last week, I spent a lot of time improving the overall UI of the application, adding a Session History page that allows the user to see statistics from previous work sessions, and testing the backend integration to ensure that all components are working well. 

I continued to build upon the UI enhancements I made last week and made it even more visually appealing. I did more research on the Chakra UI and also worked with Photoshop to add images of the headset and camera on the homepage. Below are pictures of how the current homepage looks:

The Session History page is where users can see data from all the previous sessions in one viewing allowing them to see how they are improving in limiting the number of distractions. Currently, we keep track of the session_id and frequency for each distraction when sending the data to the Django backend. I created a new endpoint (http://127.0.0.1:8000/api/session_history) and added the total number of distractions to the data payload along with the session_id and timestamp so that the frontend can fetch this information from the endpoint and display it on the react page. I made sure to update the backend so that it checks to see if the session_id already exists in the database before updating the number of distractions. This ensures that the data from the specific session_id is only shown once on the endpoint and not every time a new distraction occurs.  Users can now see a graph for Total Distractions over all sessions and when the user clicks on the bar chart, it takes the user to the specific Session Summary page corresponding to that session. Below is an example of how the Session Summary page looks:

Throughout the development of this project, I found it essential to learn several new skills and tools, particularly in frontend development using React component libraries, backend development with Django, and integrating both with hardware (camera and Emotiv EEG headset). To efficiently acquire these skills, I relied on tutorial videos on YouTube to understand React and used Stack Overflow and various Medium articles to troubleshoot specific issues I encountered with Django and database integration. Additionally, for the hardware integration, I referred to specific documentation and community forums from the EEG headset and Camera API for real-world insights and coding examples. These methods were efficient, offering targeted, real-time solutions that I could immediately apply to address any concerns during the project.

I am on schedule and am looking forward to the last couple of weeks. I am now working on integrating the Session History page with the EEG data so that our app can display a graph for the % of time in a flow/ focus state for all the given sessions. I will also continue to work on further improving the UI and preparing for the final presentation on Monday.

Arnav’s Status Report for 4/6

This week, I put a lot of effort into combining the backend and frontend parts of our project, focusing especially on adding EEG data to the frontend for the interim demo. I also looked for new ways to make our app look better and be more user-friendly by trying out different React UI component libraries. 

I worked with Rohan on integrating real-time EEG data visualization into our frontend. We created an interactive pie chart that differentiates between moments of focus and distraction, offering users a visually engaging way to understand their focus levels.

For the new UI, I looked at various React UI component libraries including Chakra UI, Material UI, and React Bootstrap. Among them, Chakra UI stood out because it is easy to use and made our app look much better. I revamped the homepage with images and descriptions of the emotive headset and camera. These enhancements help describe the technology behind the focus-tracking app, providing users with clear insights into how the system works to monitor their focus levels. Below is the new-looking homepage:

Regarding the testing/verification for my subsystem, I focused on ensuring seamless communication between our Django backend and React frontend. First, I worked on API Response Testing by sending numerous requests to our backend every minute, aiming to simulate how a user would interact with the app. This was crucial for verifying that data from the EEG headset and camera was being processed quickly and accurately. My target was for our backend to handle these requests in under a second, ensuring users experienced no noticeable delays. Next, I tested the UI Responsiveness. I wanted to make sure that as soon as our backend processed new data, our frontend would immediately reflect these updates (in under 500 milliseconds) without any need for users to manually refresh their browsers. Both tests were successfully completed and I will work on continuing to test other parts of the integration over the next week. 

Overall, I am on schedule and next week I will continue to work on enhancing the frontend for the rest of the pages and make sure that it engages the audience for the final demo. The backend integration is already complete and I will continue to test it further to ensure it is fully accurate and meets the requirements stated in our design report.

Arnav’s Status Report for 3/30

This week, I made enhancements to the user interface and overall data presentation in preparation for the Interim Demo. 

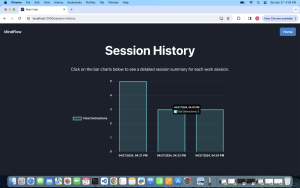
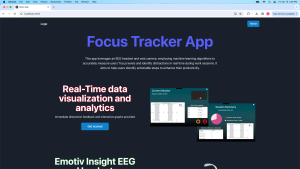
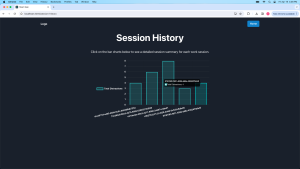
I incorporated a graph into the React frontend to visualize the distraction data collected from yawning, sleep, and gazing detection. This interactive graph, built using the Chart.js library, dynamically displays the frequency of each type of distraction over the current session. Users can hover over the graph to see detailed statistics on the number of times each distraction has occurred as well as the exact time the distraction occurred. Currently, the graph displays all the data from the current session. 

To help users track the duration of their work or study sessions, I added a session timer to the webpage. This timer is displayed on the Current Session Page and starts automatically when the session begins and updates in real-time.

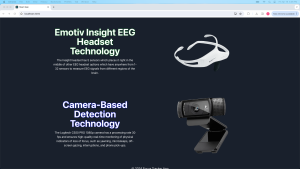
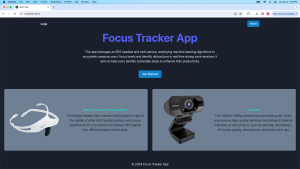
I also created a calibration page that allows a distinction between the Calibration and the Current Session page. This page features a simple interface with a green button that, when clicked, triggers the run.py Python script to start the OpenCV face detection process. This calibration step ensures that the distraction detection algorithms are finely tuned to the user’s current environment and camera setup.

To provide more comprehensive session summaries, I modified the data payload structure to include a “frequency” item. This addition stores the number of times each type of distraction occurred during the session. Once the user decides to stop the current session, they will be routed to the Session Summary Page which displays statistics on their distraction frequencies. 

Lastly, I worked with Rohan on integrating the EEG data into the Session Summary page. Leveraging Django REST API endpoints, we enabled the real-time display of EEG data. We created an EEGEvent model that stores the epoch_timestamp, formatted_timestamp, and all the relevant data needed to display the flow state detection for the user. 

The Current Session Page, Session Summary Page, and Calibration Page look like the following:

(A window pops up for the calibration when the user is on this page. This is not displayed in the picture above.)

My overall progress is doing great and I am on schedule. This week I will continue to work with Rohan to display the EEG data on the frontend in the Current Session and Session Summary Pages. The plan is to make a pie chart of the time the user is in a flow state vs. not in a flow state and also display this information in a graph format.

Arnav’s Status Report for 3/23

This week, I successfully integrated the yawning, gazing, and sleep detection data from the camera and also enabled a way to store a snapshot of the user when the distraction occurs. The yawning, gazing, and sleep detection data is now stored in a table format and the columns include Time, Distraction Type, and Image. The table is updated almost instantly with a couple of milliseconds delay and this is because I am polling the data from the API endpoints every 1 second. This can be updated if the data needs to be shown on the React page even faster, but it is most likely not needed since the user ideally will not be monitoring this page while they are in a work session. The table appears on the Current Session Page and is under the Real-Time Updates table. 

I was able to get the snapshot of the user by using the following steps: 

I first utilized the run.py Python script to capture images from the webcam which is being stored in current_frame (a NumPy array). Once a distraction state is identified, I encoded the associated image into a base64 string directly in the script. This conversion to a text-based format allowed me to send the image over HTTP by making a POST request to my Django backend through the requests library, along with other data like session ID and user ID. 

The Django backend, designed with the DetectionEventView class, handles these requests by decoding the base64 string back into a binary image format. Using the DetectionEventSerializer, the incoming data is serialized, and the image is saved in the server’s media path. I then generated a URL that points to the saved image, which can be accessed from the updated data payload. To make the images accessible in my React frontend, I configured Django with a MEDIA_URL, which allows the server to deliver media files. 

Within the React frontend, I implemented a useEffect hook to periodically fetch the latest detection data from the Django backend. This data now includes URLs for the images linked to each detection event. When the React component’s state is updated with this new data, it triggers a re-render, displaying the images using the <img> tag in a dynamically created table. I ensured the correct display of images by concatenating the base URL of my Django server with the relative URLs received from the backend. I then applied CSS to style the table, adjusting image sizing and the overall layout to provide a smooth and user-friendly interface.

 The Current Session Page looks like the following:

I made a lot of progress this week and I am definitely on schedule. I will add in data from phone detection and distractions from surroundings next week. I will also work on creating some sample graphs with the current data we have. If I have some additional time, I will connect with Rohan and start to look into the process of integrating the EEG data into the backend and frontend in real-time.


Arnav’s Status Report for 3/16

This week I focused on integrating the camera data with the Django backend and React frontend in real-time. I worked mainly on getting the yawning feature to work and the other ones should be easily integrated now that I have the template in place. The current flow looks like the following: the run.py file which is used for detecting all distractions (gaze, yawn, phone pickups, microsleep) now sends a post request for the data to http://127.0.0.1:8000/api/detections/ and also sends a post request for the current session to http://127.0.0.1:8000/api/current_session. The current_session is used to ensure that previous data is not shown for the current session the user is working on. The data packet that is currently sent includes the session_id, user_id, distraction_type, timestamp, and aspect_ratio. For the backend, I created a  DetectionEventView, CurrentSessionView, and YawningDataView that handles the POST and GET requests and orders the data accordingly. Finally, the frontend fetches the data from these endpoints using fetch(‘http://127.0.0.1:8000/api/current_session‘) and fetch(`http://127.0.0.1:8000/api/yawning-data/?session_id=${sessionId}`) and polls the data every 1 second to ensure that it catches any distraction event in real-time. Below is a picture of the data that is shown on the react page every time a user yawns during a work session:

The data is ordered so that the latest timestamps are shown first. Once I have all the distractions displayed, then I will work on making the data look more presentable. 

My progress is on schedule and during the next week, I will continue to work on the backend to ensure that all the data is displayed and I will put the real-time data in a tabular format. I will also try to add a button to the frontend so that it automatically triggers the run.py file so that it does not need to be run manually. 

Arnav’s Status Report for 3/9

This week I worked with Rohan on building the data labeling platform for Professor Dueck and designing the system for how to collect and filter the data. The Python program is specifically designed for Professor Dueck to annotate students’ focus states as ‘Focused,’ ‘Distracted,’ or ‘Neutral’ during music practice sessions. The platform efficiently records these labels alongside precise timestamps in both Epoch and conventional formats, ensuring compatibility with EEG headset data and ease of analysis across sessions. We also outlined the framework for integrating this labeled data with our machine learning model, focusing on how EEG inputs will be processed to predict focus states. This preparation is crucial for our next steps: refining the model to accurately interpret EEG signals and provide meaningful insights into enhancing focus and productivity.

Additionally, I worked on integrating a webcam feed into our application. I developed a component named WebcamStream.js. This script prioritizes connecting with an external camera device, if available, before defaulting to the computer’s built-in camera. Users can now view a real-time video feed of themselves directly within the app’s interface. Below is an image of the user when on the application. I will move this to the Calibration page this week.

My progress is on schedule and during the next week, I plan to integrate the webcam feed using MediaPipe instead so that we can directly extract the data on the application itself. I will also continue to work with Rohan on developing the machine learning model for the EEG headset and hopefully have one ready by the end of the week. In addition, I will continue to write code for all the pages in the application.

Arnav’s Status Report for 2/24

This week I worked on setting up the React Frontend, Django Backend, and the Database for our Web Application and made sure that all necessary packages/ libraries are installed. The Home/ Page looks very similar to the UI planned in Figma last week. I utilized react functional components for the layout of the page and was able to manage state and side effects efficiently. I integrated a bar graph, line graph, and scatter plot into the home page using Recharts (React library for creating interactive charts). I made sure that the application’s structure is modular, with reusable components so that it will be easy to add on future pages that are part of the UI design. Regarding the backend, I did some experimentation and research with Axios for API calls to see what would be the best way for the frontend and backend to interact with each other, especially for real-time updates. Django’s default database is SQLite and once we have our data ready to store in the database the migration to a PostgreSQL database will be very easy. All of the code written for the features mentioned above has been pushed on a separate branch to the shared GitHub repository for our team: https://github.com/karenjennyli/focus-tracker.

Lastly, I also did some more research on how we can use MediaPipe along with React/ Django to show the live camera feed of the user. The live camera feed can be embedded directly into the React application, utilizing the webcam through Web APIs like navigator.mediaDevices.getUserMedia. The processed data from MediaPipe, which might include landmarks or other analytical metrics will be sent to the Django backend via RESTful APIs. This data will then be serialized using Django’s REST framework and stored in the database.

My progress is currently on schedule and during the next week, I plan to write code for the layout of the Calibration and Current Session Pages and also get the web camera feed to show up on the application using MediaPipe. Additionally, I will do more research on how to integrate the data received from the Camera and EEG headset into the backend and try to write some basic code for that.

Arnav’s Status Report for 2/17

This week I worked on making a final draft of the wireframes and mockups for the Web Application. I finalized the Home/ Landing, Calibration, Current Session, Session Summary, and Session History pages. These are the main pages for our web application that the users will interact with. Below are the pictures of some of the updated pages:

I also did some research regarding integrating the camera feed/ metrics from the camera into the backend/ frontend code. We can break this process into the following steps: Capturing Camera Feed with MediaPipe and OpenCV, Frontend Integration with React, Backend Integration with Django, and Communication Between Frontend/ Backend. We can create a Python script using OpenCV to capture the camera feed. This will involve capturing the video feed, displaying video frames, and releasing the capture at the end of the script. We can use React to capture the processed metrics from the Python script and utilize the react-webcam library to get the video feed then send the metrics to the backend via API calls and the Django rest-framework. Our PostgreSQL database will be used to store user sessions, focus metrics, timestamps, and any other relevant data. Lastly, we will use Axios or the Fetch API to make asynchronous requests to the backend. For real-time data display, WebSockets (Django Channels) or long polling to continuously send data from the backend to the front end will be the best options.

Overall, my progress is on schedule. In the next week, I will start writing basic code for setting up the React frontend and the Django backend and begin to start implementing the UI I have created so far on Figma. I will set up the PostgreSQL database and make sure we can store any data accurately and efficiently. In addition, I will try to get the camera feed on the Calibration page of the Web Application using the steps I provided above.

Arnav’s Status Report for 02/10

This week I spent time researching both frontend/ backend technologies for Web Application Development and UI design frameworks for creating wireframes and designing mockups. Regarding frontend/ backend technologies, The Focus Tracker App would benefit from the combination of React and Django. This is due to the component-based architecture which can easily render the dynamic and interactive UI elements needed for tracking focus levels and Django’s backend is ideal for handling user data and analytics. React’s virtual DOM also ensures efficient updates which is crucial for real-time feedback. However, this tech stack also has some trade-offs; Django is not as asynchronous as Node.js, which could be a consideration for real-time features, though Django Channels can mitigate this. Vue.js is more straightforward than React and is considered to be simpler but does not include as much functionality. React also offers better support for data visualization libraries (react-google-charts, D3.js, Recharts). Regarding the database, PostgreSQL is great for working with Python-based ML models and works very well with Django.

I also drafted some wireframes on Figma for our app’s Landing Page, Calibration Page (for the camera and EEG headset), and the Current Session Page. Below are pictures:

My progress is on schedule. In the next week, I plan to have the wireframes of all the pages complete as well as the mockup designs. This includes the following pages: Home/ Landing, Features, About, Calibration, Current Session, Session Summary, Session History, and Top Distractions. I will also implement a clear and detailed plan (including diagrams) for the code architecture. This will have all the details regarding how the frontend and backend will interact and what buttons will navigate the user to certain pages.