Denise’s Status Report for 3/19

During this past week  I was successfully able to turn transform .jpeg and .png files comprised of lines like the one depicted below in .svg files using VTracer via a Python script.

This week I also reviewed the design feedback and after meeting with professor Savvides, I discussed with my group about pivoting to adding marks to the physical diagrams to identify which lines should be straight within the diagram. Note that these marks should not be rendered in the final image. I have been reviewing our design report and making modifications to the use case requirements, abstract, and introduction based on the feedback. I also have been discussing with my team

In terms of the planned work, I am ahead of schedule however editing the design report was not something we accounted for but overall I am still on schedule.

Once my teammates set up a bare bone Web App GUI, I will work on importing the .svg files and adding translation/scaling features to the GUI. I will need to add more to the Python script to correctly parse the files to generated from Lisa’s CV portion and write it to a directory accessible for Ronald’s server code. In the meantime, I will continue updating the design report.

Denise’s Status Report for 2/26

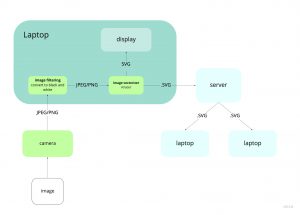
This week I worked on researching different .SVG converters since we decided to move our vectorization process into the software side in order to avoid having to compare different frames with a temporal approach. The two main methods I looked into were using Potrace and Vtracer. In the end we decided to go with Vtracer since it works with colored .PNG files as well and has better image fidelity; meaning that the .SVG resembles the image more accurately.

I also designed a mock up of our GUI in Figma and discussed with Ronald what features/buttons we should add for better user interactions.

GUI: https://www.figma.com/file/iI5Mw8cfi4QE14hJeFnFHg/DrawBuddy-GUI?node-id=0%3A1

I worked on putting together a design proposal presentation and focused on the use-case, use-case requirements, and system approach/implementation plan.

https://docs.google.com/presentation/d/14MaQNsqbtGYA0_ZN-x0DoQWcdriZ-3-VRN1r-oDmobM/edit?usp=sharing


Team Status Report for 2/26

What are the most significant risks that could jeopardize the success of the project? How are these risks being managed? What contingency plans are ready?

The most significant risks currently are ensuring that the images can be vectorized efficiently since the latencies have not currently  been tested although it looks promising since the algorithm Vtracer uses also includes line simplification which would reduce the number of point per primitives. If Vtracer is not fast enough then we will also consider PoTrace or and reverting back to vectorizing with Computer Vision using a temporal approach

System Design Changes:

This week we pivoted our design to do our vectorization on the software side with the help of Vtracer, a Python .PNG to .SVG converter. We considered using other .SVG converting packages like PoTrace but decided to go with a Vtracer due to it’s support for colored images in case we do want to extend for our stretch goals of adding colored diagrams and it also maintains better fidelity of the original image when compared to PoTrace. This change in decision does not incur any additional costs to our project. We are also looking into methods to remove having the user need to agree to receive a message from a peer in order to make the user interaction smoother. This is still currently being researched but should not cause any major changes to the system.

The schedule has not changed. Currently our message passing is successful and within our latency bounds and our CV is able to detect roughly straight lines without much difficulty.

Denise’s Status Report for 2/12

During this week I helped put together the use case, use case requirements, and solution approach slides for our proposal presentation. After everyone added their content, I revised each slide to be more concise by reducing the amount of words for better readability.  After that I spent a couple of hours figuring out what I would say in each slide, practicing, and revising the presentation to fit it in under 12 minutes.

We currently are on schedule, although the schedule may need to be revised for more slack time.

This week I will work on continuing to research how to vectorize images, and then also take a look into strategies to translate and scale the vector objects. I will also look into algorithms to reduce the amount of points generated from CV.