So the past two weeks I’ve been working on creating a grapher for the prints we want using their gcode files.
I’ve finished my first passes at it, but the issue that is now arising is it’s presentation when it comes time to compare it to the actual image.
I have two examples included, (both gcode files I got off of thingiverse)
The first is a puzzle piece. From all around, it looks good and similar to the slicer’s view of it, but when looking at the graph from the view we think our camera would be at, there are all the gaps in between each layer. I think this is because of how python has automatic axes (I’m not entirely sure of this and will work on fixing it)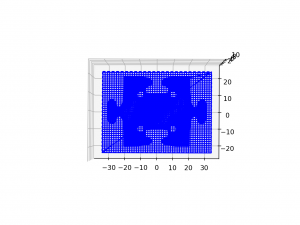
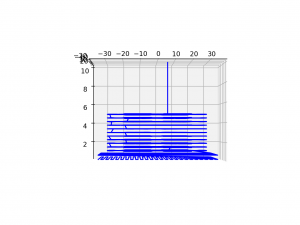
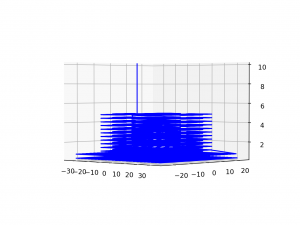
The second object was a classic coke bottle. This one had some different issues. With the puzzle piece, There’s the final line of the extruder returning to its original position, but that doesn’t get in the way of the piece. For the coke bottle, the extruder is returning to such a high z-value, that it shrunk the look of the print in the graph. I will probably need to go into the actual gcode file and find out where this last step is and change it’s value so that this issue is fixed.
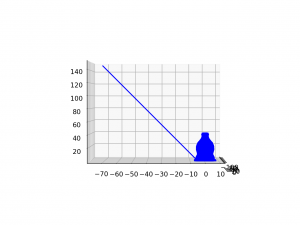
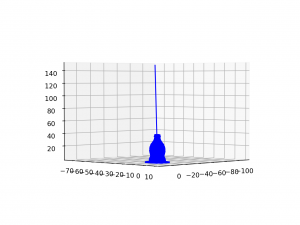
So this upcoming week is really about fixing my graphs and getting these images to Joshua so we can test the edge detection. Then, working with Lucas and the more advanced parser, we want to try and be able to figure out how long each layer takes and from there perform multiple comparison tests for one object.
