I rewrote a lot of the existing code I had to be more easily integratabtle into our current GUI solution with an Object oriented approach to create our Test Suite where we will be displaying the graphical information, the data being generated, and the functions working. I can show the packets that I’ve generated, but I’m still trying to figure out a good way to display the information to the viewer that isn’t just a million bits at a time. I’ve worked with the team to hammering out our system construction so all that’s left is just throwing more algorithms at our test suite, displaying information, and continual integration with the team.
I did a lot of work on refining the GUI and the displaying of data in an easy to see format.

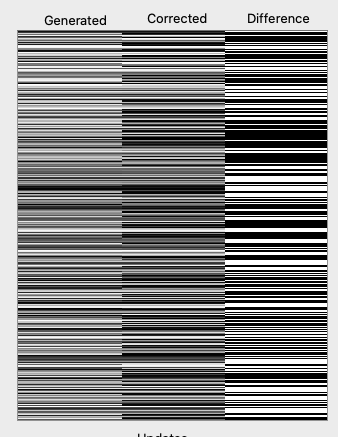
This is an example of the data generated in three steps with a chance of a bit flipping being 1/12. The first bar is the generated data of 8bit packets set to grey scale, the second bar is the corrected data that the decoding algorithm has performed on the encoded fuzzed data, the third bar shows the difference between these two bars with white meaning that the data has been correctly decoded and black meaning that it has either corrected the wrong data or could not be fixed.
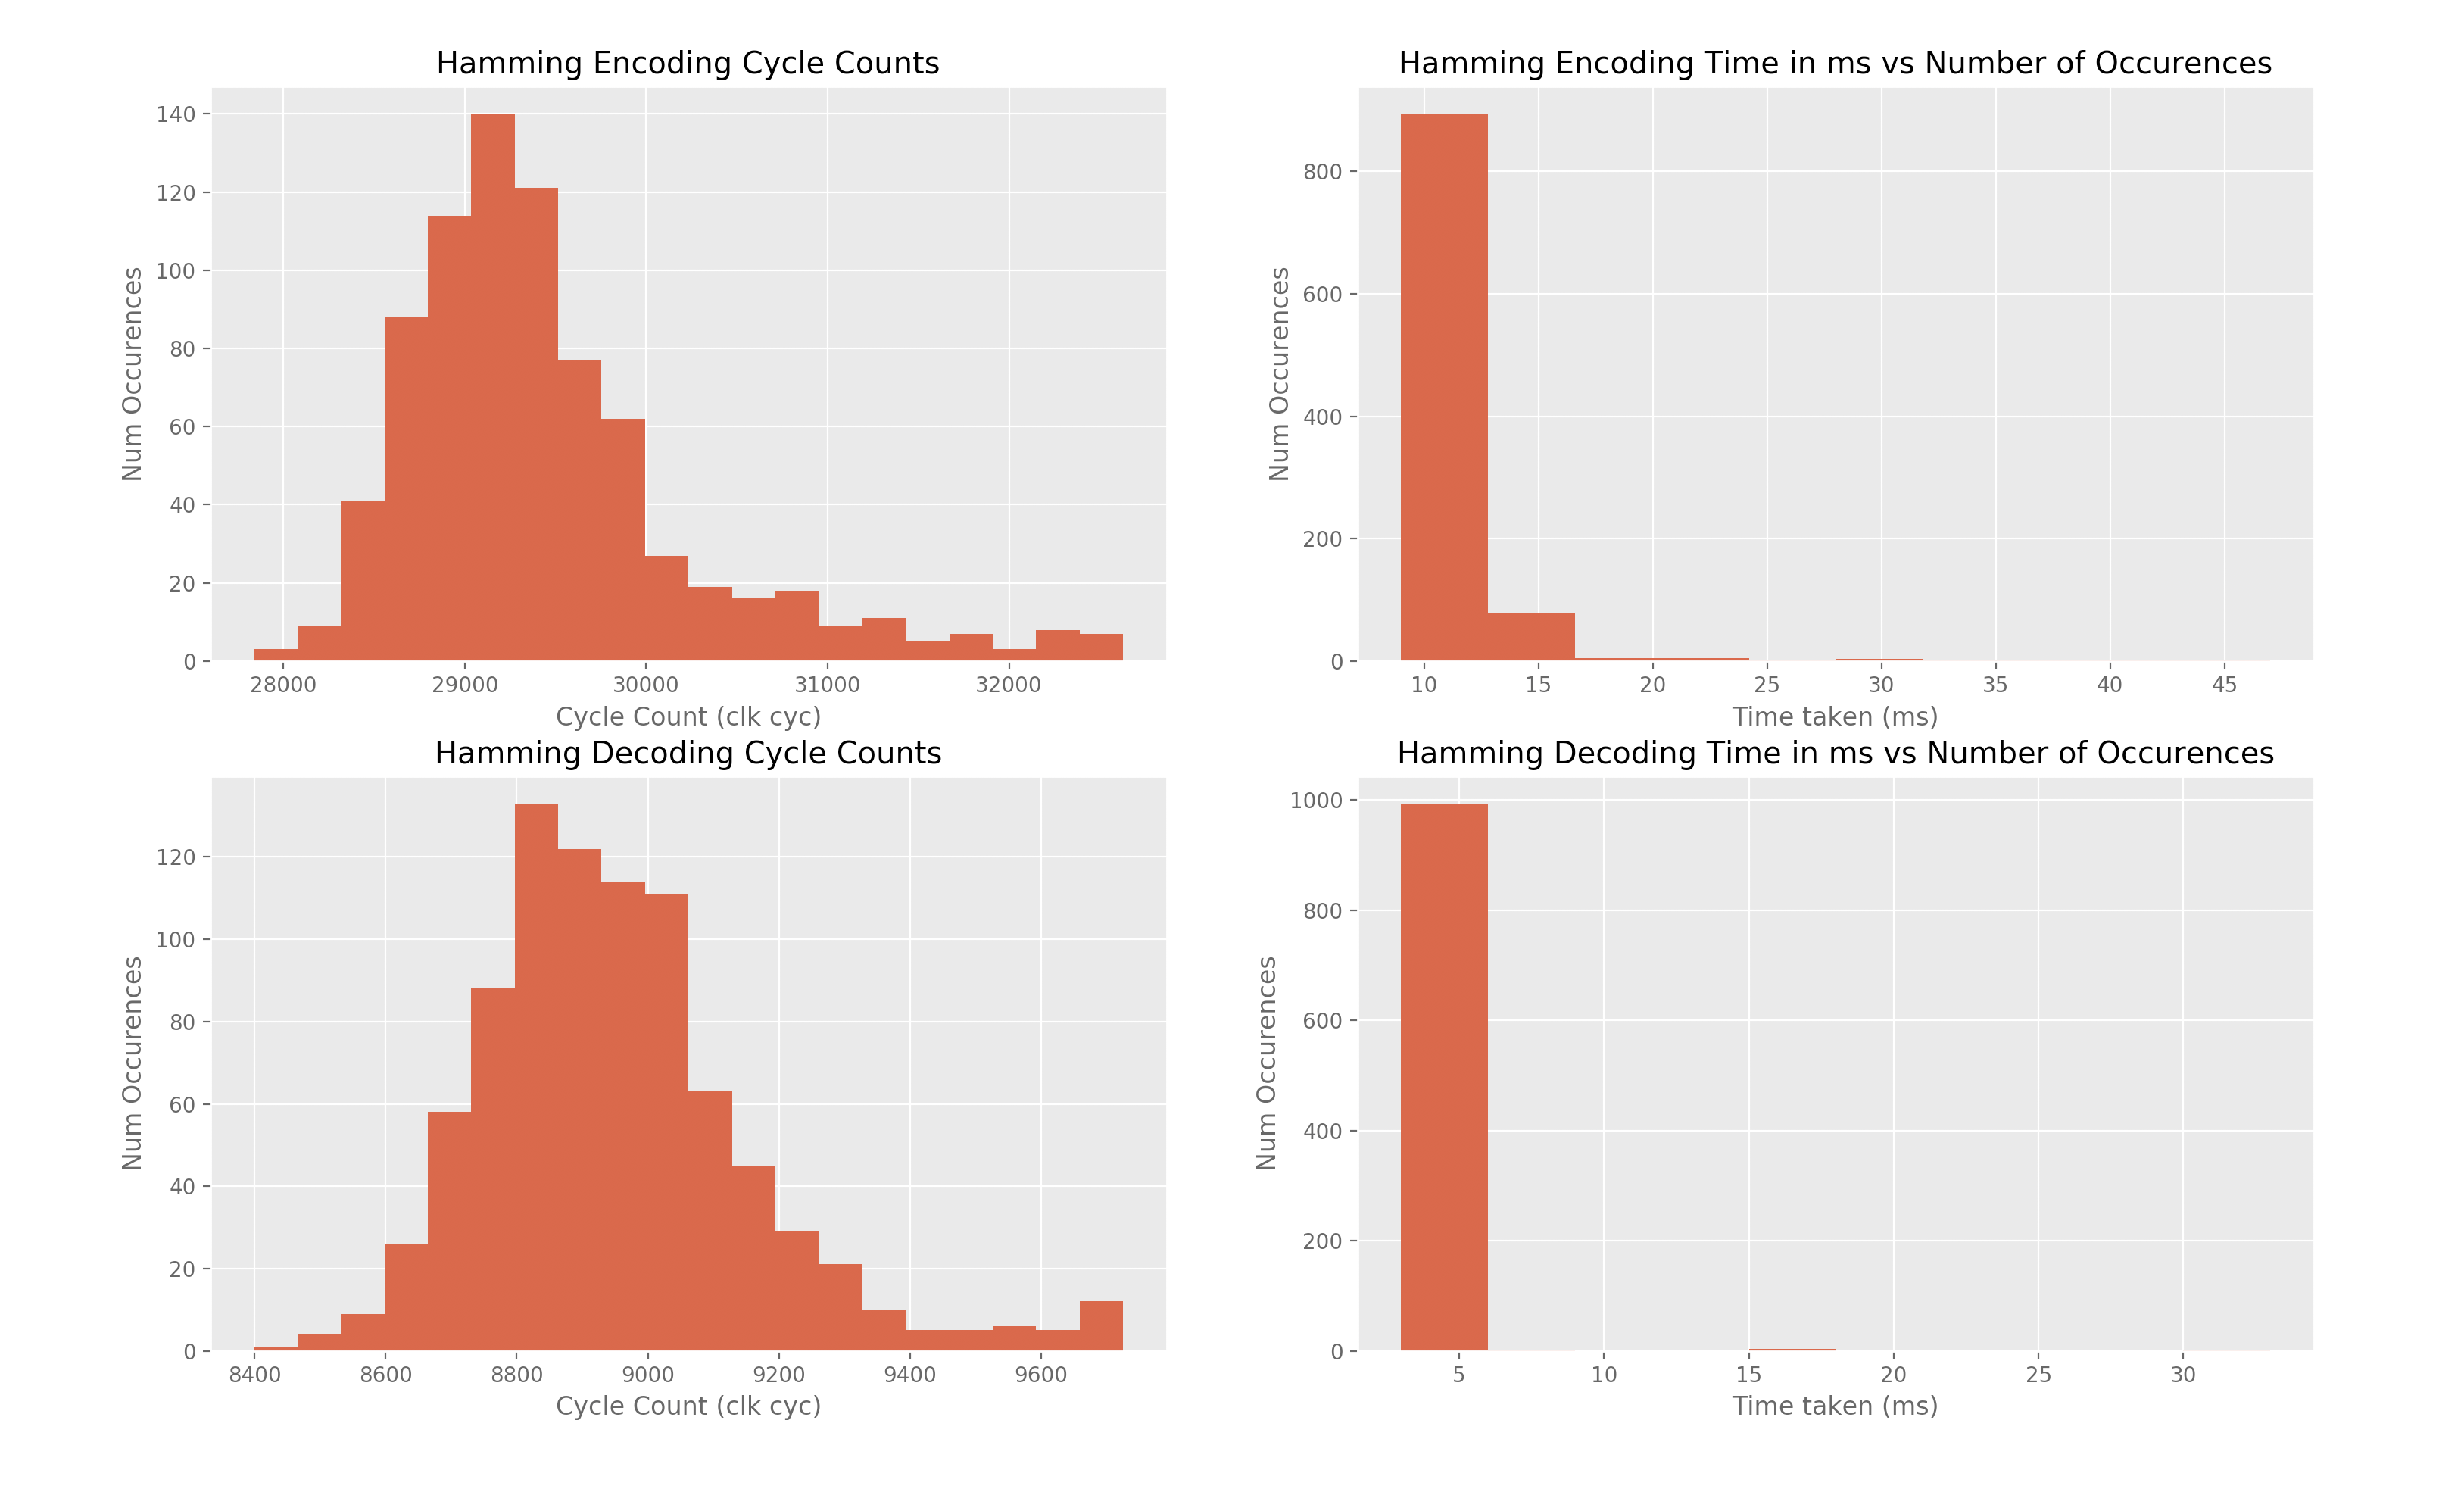
I also worked on performance benchmarks since we are working to meet the requirements of less than 1mil instructions, my simple encoding and decoding functions for hamming show these results.

I ran my encoding and decoding functions 1000 times and plotted in a histogram. The cycle count is well within the limits, but we will need to test the remaining algorithms to see how they perform.
I also tried to package the gui into its own executable, but did not have success. I think a thorough documentation on how to get started will suffice though.
Is your progress on schedule or behind? If you are behind, what actions will be taken to catch up to the project schedule?
More algorithms! Shouldn’t be too bad.
