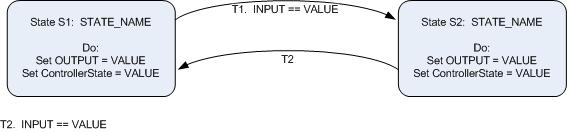
Figure 1: Statechart Sample
Spring 2016
NOTE: Lab 3 consists of two components (Lab 3 Part A and Lab 3 Part B).
Relevant lectures:
- Part A: Lectures 3-4. Microcontroller Instruction Set
- Part B: Lecture 5. Engineering Process and Design Techniques
Links to all files referenced in the lab and prelab can be found in the
Files section at the end of this document.
Goal:
Discussion: This lab focuses on calls to subroutines and program
timing.
The CPU12 program
reference describes the function of the instructions used to call
subroutines and return from them. Look up the instructions BSR and RTS
and study their description.
Instructions take varying numbers of cycles to execute, depending on the
addressing mode, the types of memory accessed, and other instruction-specific
factors. For each instruction, the CPU12 reference describes the
cycle-by-cycle execution of the instruction. Review pp. 73-75 for
information on how to compute the number of cycles for a particular
instruction. In the instruction set glossary (Section 6.7), note that you
should refer to the M68HCS12 column for instruction timing.
In the Code Warrior IDE, the "Full chip simulation" build target is another way of measuring instruction cycle times. When run with this target, the computer will simulate the operation of the processor. The simulation allows you to measure the number of cycles that have elapsed in the program.
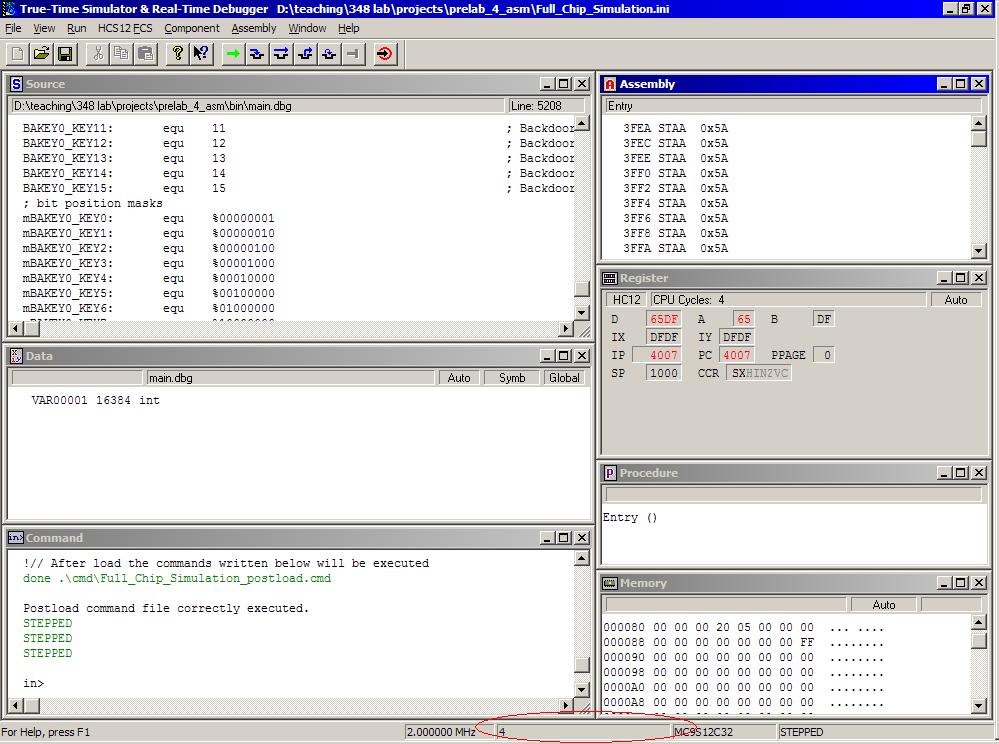
The screenshot above shows the location of the cycle count circled in red.
One behavior of the simulator that is important to note:
If you declare a word-sized RAM location (for example, "my_ram
DS.W 1") and then write an 8-bit value into it (for example,
using "STAA my_ram"), you will find that the Data window in the
simulator shows the memory as being "undefined". The memory is
written correctly by the simulator, but the value will continue to be displayed
as "undefined" until a word-size value is written (for example,
"STD my_ram"). You can avoid this by declaring byte-size RAM
locations if a byte is all you need (for example,
"my_byte DS.B 1"). If you must use a
word-size memory, you can right click the name in the Data window and choose
"Show location", and the Memory window will show the current value of
the RAM location.
Part A Procedure:
For this prelab, you will complete a program file by implementing a subroutine and calling that subroutine from the main code execution. You will then compute the best-case instruction timings and verify those timings with simulated execution.
Part A Questions:
NOTE: The wiper code developed in Lab 3 will be later used in Lab 8. Make sure you get it right now (yes, the design, too) while you have the time.
Goal:
Use a statechart based on requirements to create a piece of software. Also, using timing loops to animate an LED display.
Discussion:
Having good software process is an important part of systems
engineering. Starting out "hacking code" without a clear
definition of what the system functionality should be is a good way to get bad
software! The early stages of software process (including requirements
and statecharts) should be separated from the implementation. This allows you
to work out the specification and understand what you are supposed to be doing
before you actually try to do it.
Requirements specify behaviors of the system. Statecharts are a way of
capturing these system behaviors in a visual format. Statecharts are composed
of states which are connected by transitions. (They are a lot like Finite State
Machines that you've seen in hardware design -- except these are for
software.) A state is composed of a state name, state number, and a
description of the system behavior in that state. A transition is a
directional arc connecting two states. It specifies the condition or
conditions that must be met for the state machine to change from one state to
another.
Part B Procedure:
In this prelab, you will use the requirements below to develop a statechart
for a windshield wiper controller.
Inputs:
OffButton - Indicates user preference to turn the wipers off. Values are
PRESSED or UNPRESSED.
SlowButton - Indicates user preference to set the wipers to slow speed.
Values are PRESSED or UNPRESSED.
FastButton - Indicates the user preference to set the wipers to fast
speed. Values are PRESSED or UNPRESSED.
WiperPosition - Indicates the current position of the wiper. Values go
from WP_MIN to WP_MAX
Outputs:
WiperRate - Sets the speed of the wiper. Values are STOP, SLOW, or FAST.
Internal State:
ControllerState - the current state of the controller. Values are OFF,
SLOW, FAST, and PARK
Requirements:
R1. The controller shall implement the following states: OFF, SLOW, PARK,
and FAST.
R2. PRESSing buttons shall result in the following transitions:
R2.A. OffButton shall result in a transition to the
OFF state.
R2.B. SlowButton shall result in a transition to the
SLOW state.
R2.C. FastButton shall result in a transition to the
FAST state.
R2.D. Button requests for the following transitions
shall be ignored: OFF to FAST, FAST to OFF.
R3. The system shall only be in the OFF state when WiperPosition is less
than or equal to WP_MIN
R4. A delay in any required state transition of up to one full wiper
cycle is acceptable.
Implementation hint: use the PARK state to get from SLOW to OFF without violating requirement R3.
State Chart Style Guide:
Figure 1 shows a sample statechart and some sample transitions. Your
statecharts must include:
Note that both the States and the Transitions are numbered separately.
You may represent your transitions with the conditions on the arc (as in T1) or
just number the arcs and show a separate list of the transition conditions (as
in T2).
The fill color, font, and shape (rectangles without rounded corners are okay)
may be altered, as long as the intent of the state chart is still clear and
everything is easily readable.
Microsoft Visio is a reasonable tool for doing statecharts. There are
licenses for Visio in some campus computer labs. Alternatively, you can
use powerpoint, word pictures, or some other program, as long as it produces
legible results according to the form above. Note that the final
submission format must be PDF, per the course policy.
Part B Questions:
| State /
Transition --> |
S1:
STATE_OFF |
S2:
STATE_PARK |
.... |
T1 |
T2 |
... |
| Requirement |
||||||
| R1. |
X |
|||||
| R1.A. | ||||||
| .... |
Bonus. (8pts) Do an additional
statechart with an extra state and additional transitions to include
intermittent operation, where the wiper pauses in the "off" position
between each round trip over the windshield. Intermittent operation
should come between Off and Slow from the user point of view and be associated
with an IntermittentButton.
Hand-in Checklist: (90 + 18 points)
Preferred submission format is a
SINGLE PDF
document. If you are unable to combine documents (or paste everything
into Word before PDF conversion), you may submit multiple PDF documents.
Double
check your Statecharts after PDF conversion!!! Be sure the font and graphics
are clear and legible.
Part A:
Part B:
Refer to the LAB FAQ for more information on lab
hand-in procedures and file type requirements. You MUST follow these
procedures or we will not accept your submissions.
Goals:
Understand stack pointer operations and learn about calling functions using the
stack. Learn about timing functions using multiple executions.
Discussion:
Stack and Stack Pointers:
The stack is an area of of memory (RAM) that is allocated for general
purpose use by the program. The stack pointer and the associated push and
pull operations provide a structured way of handling the stack memory.
This structure is usually referred to as a stack frame.
The stack frame structure we will use for this lab is:
| Lower memory addresses
|| || \/ Higher memory addresses |
Local memory |
/\ || || Stack grows "downward" |
| Return Address |
||
| Arguments to functions (1st arg in highest
memory) |
An example stack frame is shown below:
| Memory location |
Stack Memory Values |
| $0FF8 |
local var 2 |
| $0FF9 |
local var 1 |
| $0FFA | return address (upper byte) |
| $0FFB | return address (lower byte) |
| $0FFC | retval (upper byte) |
| $0FFD | retval (lower byte) |
| $0FFE |
arg2 (upper byte) |
| $0FFF |
arg2 (lower byte) |
| $1000 |
arg1 |
In this example, note the byte order for storing 2-byte values. The
most significant byte of a 2-byte value is stored in the
lower memory address. This is
the "big endian" format. In this stack frame convention,
arguments are pushed in order. That is to say, if a c-style function
definition was written for the above code, it would look like this:
unsigned int myFunction(unsigned char
arg1, unsigned int arg2);
The table below describes the steps that occur when calling a function using the stack to pass values and the stack pointer value after the operation. The stack pointer is $1001 at the beginning of the call.
| Step |
Operation |
Stack pointer after operation |
| 1 |
Calling code pushes arg 1 (see PSHA,
PSHB, PSHD, etc) |
$1000 |
| 2 |
Calling code pushes arg 2 |
$0FFE |
| 3 |
Calling code moves the stack pointer to create
the return value (see documentation for the LEAS instruction) |
$0FFC |
| 4 |
BSR automatically pushes the return address
onto the stack |
$0FFA |
| 5 |
Subroutine code moves the stack pointer to
create local variables 1 and 2 |
$0FF8 |
| 6 |
Subroutine does computations and stores result
in SP+5 (return value) |
$0FF8 |
| 7 |
Subroutine moves stack pointer to destroy the
local variables. |
$0FFA |
| 8 |
RTS returns execution back to the return
address location and automatically pops the return address off the stack. |
$0FFC |
| 9 |
Calling code performs some action to store or
use the return value. |
$0FFC |
| 10 |
Calling code moves the stack pointer to
destroy the arguments and the return value. |
$1001 |
Notes:
All references to items on the stack (arguments, return values, and local
variables) should be relative to the stack pointer. The following code
shows some examples (assuming the stack pointer value is $0FF7)
STAB 2,
SP ;write B into local var 1
LDD 7, SP
;load argument 2 into register D
STD 5,
SP ;write register D into return
value
Part A Questions & Procedure
(Note: questions and lab procedure are presented in the order you should perform them. Please be sure to hand in answers to all the required questions)
Part A.1:
The subroutine you will write for this lab will have the form:
unsigned int customFunction ( unsigned
char m, unsigned char n, unsigned int p, unsigned int q);
Q1. (15 points) Draw out the stack frame for this subroutine. Use the same table structure as Table 2 above. Use the following assumptions:
Part A.2:
Q2. (5 points) Copy the following table into your writeup and record
the results. All parameter values should be before execution except for the
return value, which is after execution.
| Parameter |
Value |
| m |
|
| n |
|
| p |
|
| q |
|
| return value (after execution) |
Part A.3:
BONUS - Part A.4 (Optional):
Answer the following question in your writeup. Fewer words are better. Bullet points are better than complete "essay" sentences.
BONUS Q4. (2 points) What advantages does passing arguments to subroutines on the stack have over passing arguments in registers or global variables? (150 words; at least 2 advantages)
BONUS - Part A.5 (Optional):
One way to test the maximum amount of stack memory used by a program to prevent stack overflow is sometimes called stack watermarking. The idea is to put some known special value in RAM where the stack is and see which values get modified when running the program. The deepest stack memory location that is modified is the "high water mark." You have to be careful to make sure you run the worst case biggest use of the stack, but it is a way to check to make sure analysis you've done is correct. This bonus question is to implement a simple stack watermarking approach on the course simulator and hardware. Use it to determine how deep the stack gets when executing the following function to compute fib(17). Note that the simulator keeps track of "uninitialized" memory for you. But in real hardware it powers up with some value that you have to set before you run the watermarking program. It is OK to use the debugger after a program run to examine stack memory to determine the watermark place; it need not be done automatically. It is also OK to compare real hardware with the simulator to see if your watermarking approach is working properly. You can write your code in assembly language or C as you prefer, but it must be a recursive rather than an iterative implementation. Name this file lab3_parta5_gXX.c or lab3_parta5_gXX.asm as appropriate.
BONUS Q5. (5 points) How many bytes of stack did fib(17) use? Explain how your approach works in 50 words or fewer.
unsigned int fib(unsigned int n)Part A - Demo Checklist:
NOTE: The wiper code developed in Lab 3 will be later used in Lab 8. Make sure you get it right now (yes, the design, too) while you have the time.
Goal:
Briefly: implement the system described by the statechart in assembly language.
You will be provided with most of the code but must implement the actual state
machine transitions yourself.
Discussion:
In the lab, you will implement the statechart that you created in the
prelab. A majority of the code has been provided. You will be
expected to complete the code and demonstrate a working prototype of the wiper
controller.
The code in Lab 3 Part B Skeleton contains a framework for implementing the state
chart you designed in the prelab. It also contains code that controls the
motion of the wiper. You can provide inputs to the wiper control code by
modifying the WiperSpeed global value. You can read the wiper position
output by reading the WiperPosition variable. The ControllerState
variable contains the current state of the state machine. You should
examine the code and comments and try to understand how the code works.
Be sure to follow the coding style sheet for code in this (and all subsequent) labs!
Part B Procedure:
Part B.1:
The wiring for this board is the same as the wiring for Lab 3 Part A, except for
the following. Note that there are no inputs used on Lab 3 Part A, so the wiring
between these two labs is compatible (for easy demonstration).
Create a new assembly project using the
348 stationery. Download
the lab 3b skeleton and replace the main.asm
with this file. Follow the steps below to implement a working prototype
of the controller.
Part B Questions
| State or Transition |
Implementing Code |
| S1 |
line XX |
| .... |
.... |
| Number of cycles in NOP loop routine |
|
| Time to execute NOP loop routine |
|
| % error (from 1/14 s nominal) |
| Slow State |
Fast State |
|
| Length of 10 wiper cycles |
||
| Length of 1 wiper cycle |
||
| Time between wiper movements |
||
| % error (from 1/14 s nominal) |
Bonus (Optional)
Add an input "WiperInterval" to the wiper update subroutine.
Define this as the number of wait loops between wait loops (i.e., the wiper makes
one cycle, then waits WiperInterval wait loops, then continues with another
cycle. Use this to add an INTERMITTENT state to the system as described
in the prelab. The intermittent state should come between off and slow as
the user sees it. (Note that the Park state is still applicable, but in a
different way perhaps.) The behavior for intermittent state is that the
wiper runs one slow cycle (2s), then waits 1s, then runs another slow cycle,
etc. Hand in the result as Lab3b_bonus_gXX.asm
Part B - Demo Checklist: (50 + 10 points)
Hand-in Checklist: (135 + 22 points)
All non-code parts of the hand-in should be submitted as a single
document. Code files should be submitted separately, per the lab FAQ.
Part A:
Part B:
Be sure to save your code from this lab; you will need it for a later lab!
Refer to the LAB FAQ for more information on lab hand-in procedures and file type requirements. You MUST follow these procedures or we will not accept your submissions.
Part A:
Part B:
Part A:
Part B:
Also, see the course materials repository page.
Change notes for 2016: